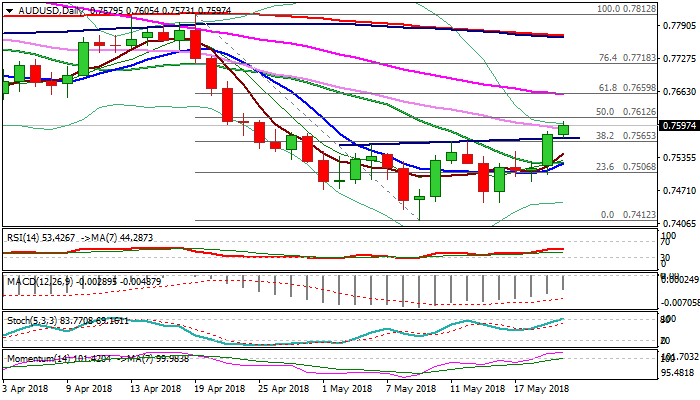
The Aussie dollar advanced further on Tuesday as strong bullish signal was generated on Monday’s rally and close above pivotal 0.7565 barrier (former double-top / Fibo 38.2% of 0.7812/0.7412 fall) and completion of inverse H&S pattern on daily chart.
Strong bullish momentum and double bull-cross (5/20 & 10/20SMA) underpin recovery which pressures barrier at 0.7612 (daily Kijun-sen / 50% retracement) and may extend towards next key points at 0.7642/60 zone (weekly cloud base / 29 Mar former low / Fibo 61.8% of 0.7812/0.7412 / falling 55SMA), break of which would confirm reversal.
Slow stochastic is entering overbought zone, suggesting that dips may precede fresh rally. Former pivotal barrier at 0.7565 is expected to ideally contain and keep fresh bulls intact.
Only return below 0.7530 (20SMA) would neutralize and risk further weakness.
Res: 0.7612, 0.7642, 0.7660, 0.7700
Sup: 0.7573, 0.7565, 0.7542, 0.7530