
Key Highlights
- The US Dollar struggled to settle above 1.2900 against the Canadian Dollar and declined.
- There is a major bearish trend line in place with resistance at 1.2860 on the 4-hours chart of USD/CAD.
- Canada’s Wholesale Sales in March 2018 increased 1.1% (MoM), more than the forecast of 0.6%.
- Today in the US, the Manufacturing PMI for May 2018 (Prelim) will be released, which is forecasted to remain at 56.5.
USDCAD Technical Analysis
The US Dollar formed a top just below the 1.3000 handle against the Canadian Dollar. The USD/CAD pair declined and is currently trading just above a crucial support at 1.2700.
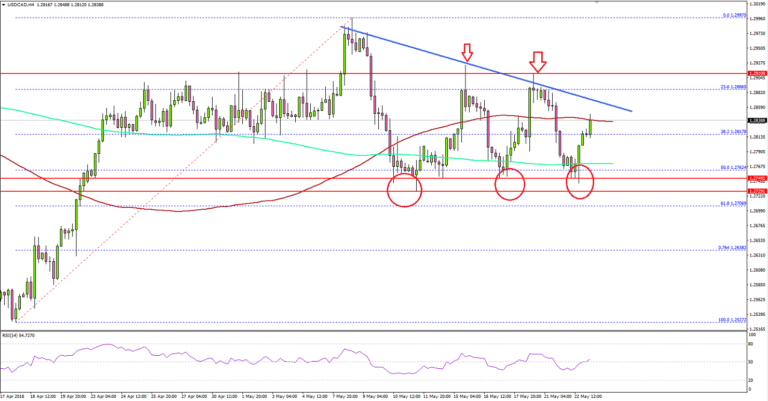
Looking at the 4-hours chart, the pair started a downside move from the 1.2997 high. It declined and settled below the 1.2900-10 pivot level. During the decline, the pair also broke the 38.2% Fib retracement level of the last wave from the 1.2527 low to 1.2997 high.
However, the downside move was protected by the 1.2700 support zone. Moreover, the 50% Fib retracement level of the last wave from the 1.2527 low to 1.2997 high also provided support.
Recently, the pair bounced, but it failed to break the 1.2900 resistance and a major bearish trend line in place with current resistance at 1.2860. The pair declined once again and is currently trading just above the 1.2700-20 support area.
Should there be a break below 1.2700, the pair may decline sharply back towards 1.2500. On the upside, a break above 1.2860 and 1.2900 is required for a bullish extension.
Economic Releases to Watch Today
- Germany’s Manufacturing PMI for May 2018 (Preliminary) – Forecast 57.8, versus 58.1 previous.
- Germany’s Services PMI for May 2018 (Preliminary) – Forecast 53.0, versus 53.0 previous.
- Euro Zone Manufacturing PMI May 2018 (Preliminary) – Forecast 56.0, versus 56.2 previous.
- Euro Zone Services PMI for May 2018 (Preliminary) – Forecast 54.6, versus 54.7 previous.
- UK Retail Price Index April 2018 (YoY) – Forecast +3.4%, versus +3.3% previous.
- UK Producer Price Index April 2018 (YoY) – Forecast +5.8%, versus +4.2% previous.
- UK Producer Price Index April 2018 (MoM) – Forecast +1.0%, versus -0.1% previous.
- UK Consumer Price Index April 2018 (YoY) – Forecast +2.5%, versus +2.5% previous.
- UK Core Consumer Price Index April 2018 (YoY) – Forecast +2.2%, versus +2.3% previous.
- US Manufacturing PMI for May 2018 (Preliminary) – Forecast 55.6, versus 55.6 previous.
- US Services PMI for May 2018 (Preliminary) – Forecast 55.6, versus 55.6 previous.


