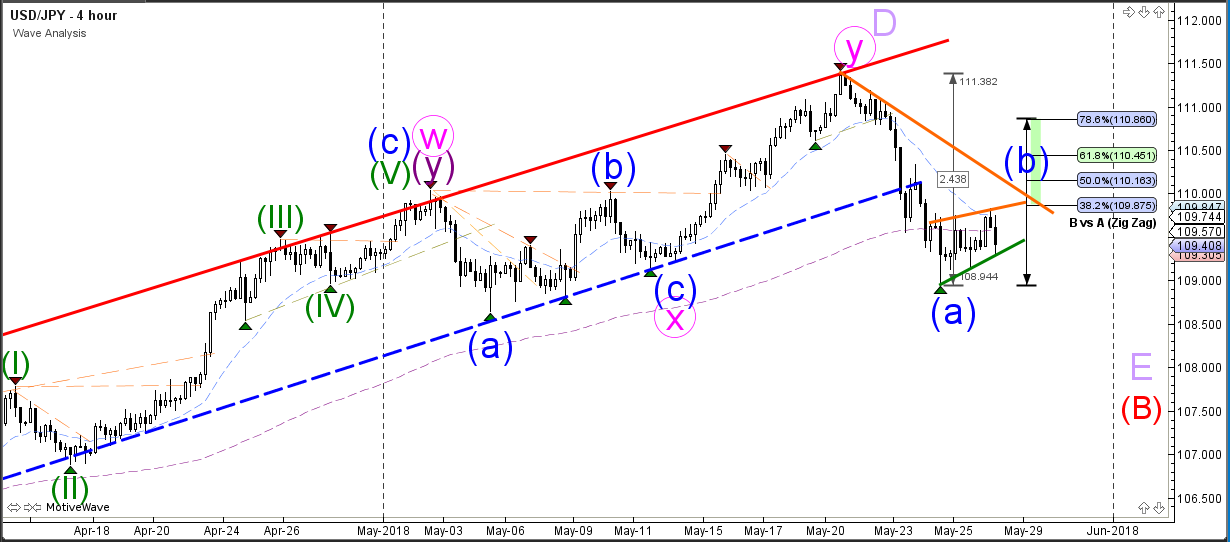
The USD/JPY bearish momentum is probably a wave A (blue), which is part of larger ABC zigzag. A bullish break above the resistance trend lines could indicate that the bearish wave A (blue) is completed and that price will retrace as part of a bullish ABC correction within wave B (blue). In that case the Fibonacci levels of wave B could act as a potential resistance spots for a bearish turn.
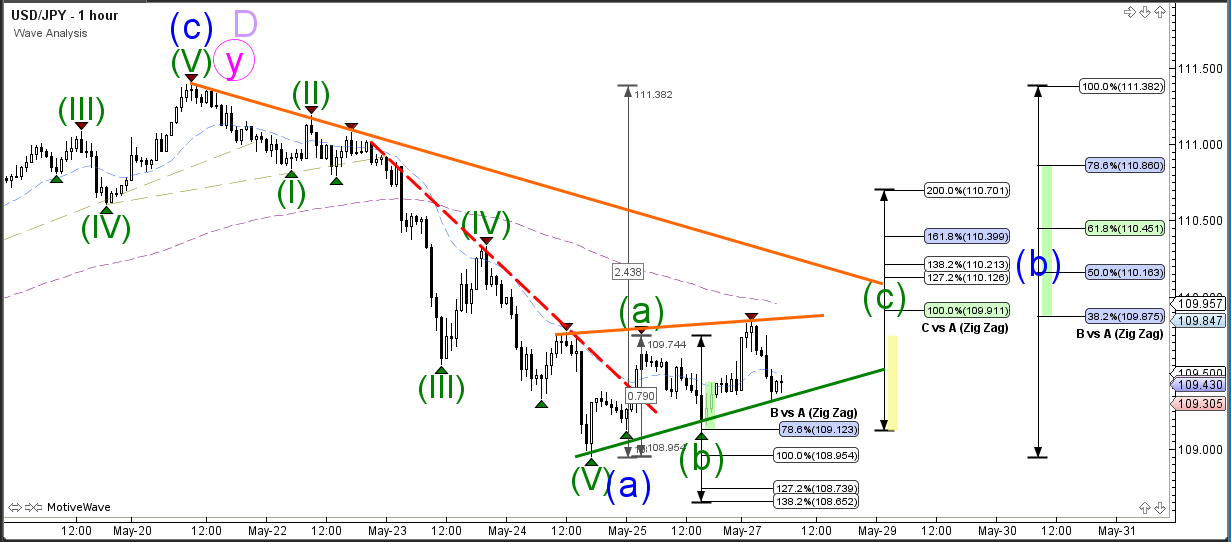
The USD/JPY is building a corrective triangle pattern. A break below the support trend line (green) could indicate an expanded 5th wave within wave A (blue) whereas a break above the resistance trend lines (orange) would increase the chances of a wave C.