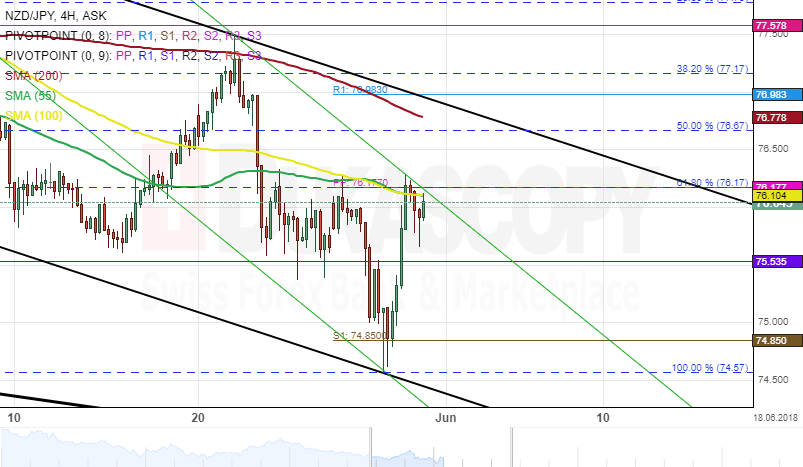
The bearish sentiment which dominated the NZD/JPY currency pair since late January 2018 has resulted in the pair to trade in several descending channels. The most important is the junior pattern which has guided the New Zealand Dollar down against the Japanese Yen.
A Strong resistance cluster set by the 55– and 100– hour simple moving averages, the weekly pivot point, and the 61.80% Fibonacci retracement level has hindered the pair to break out from the upper boundary of the descending pattern.
In the meantime, technical indicators flash sell signals during the following week, suggesting that the pair might maintain it channel down. In case a breakout occurs, the pair could target the 200– hour SMAs at 76.77.