

Live Comments
Canada GDP Stalls Again in August, September Estimate Points to Contraction
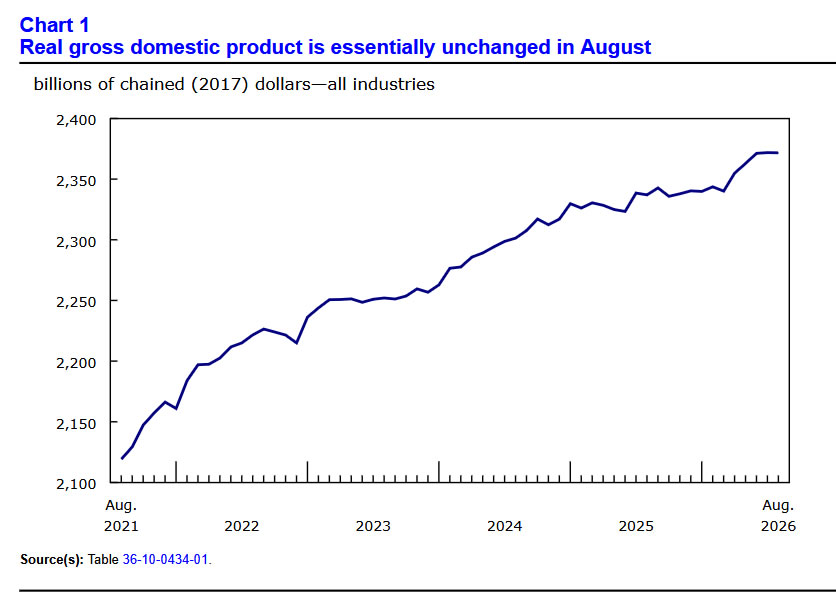
Canada's economy stagnated for a second consecutive month in August, with real GDP essentially unchanged against market expectations of 0.2% growth. The weakness may have extended into September, as Statistics Canada's advance estimate points to a 0.1% contraction, driven by declines in manufacturing and mining, quarrying, and oil and gas extraction. Despite the subdued monthly performance, preliminary estimates suggest GDP expanded 0.3% q/q in Q3, supported by stronger activity earlier in the quarter.
August's sector breakdown revealed contrasting developments. Retail trade rebounded 1.2% after contracting 1.1% in July, supported by motor vehicle dealers, food retailers and general merchandise stores. Manufacturing also expanded 0.3%, helped by machinery production and petroleum refining. However, these gains were offset by a 1.4% contraction in wholesale trade, the largest drag on overall GDP, alongside weakness in public administration and oil and gas extraction. Goods-producing industries edged up 0.1%, while services-producing industries declined 0.1%, leaving aggregate output essentially flat.
The figures suggest that Canada's economic momentum weakened considerably toward the end of Q3, despite pockets of resilience in consumer-facing industries and manufacturing. September's estimated contraction is particularly concerning because it points to renewed manufacturing weakness following August's modest expansion, while resource extraction continued to struggle. Although the preliminary 0.3% quarterly growth estimate indicates that the economy continued expanding over Q3 as a whole, the absence of meaningful growth in July and August, followed by an estimated September decline, suggests a fragile underlying trend. The official September and Q3 GDP figures are scheduled for release on November 30.
Data Summary
Canada GDP by Industry — August 2026
Statistics Canada, released October 30, 2026
| Indicator | Jul | Aug | Cons |
|---|---|---|---|
| Real GDP M/M | 0.0% | ~0.0% | +0.2% |
| Goods-Producing Industries M/M | +0.2% | +0.1% | — |
| Services-Producing Industries M/M | ~0.0% | -0.1% | — |
Preliminary GDP Estimates
| Indicator | Estimate | Status |
|---|---|---|
| September GDP M/M | -0.1% | Advance estimate |
| Q3 GDP Q/Q | +0.3% | Preliminary indication, not annualized |
Selected Industry Performance — July → August 2026
| Industry | July | August |
|---|---|---|
| Retail Trade | -1.1% | +1.2% |
| Manufacturing | ~0.0% | +0.3% |
| Construction | +1.4% | +0.2% |
| Transportation and Warehousing | ~0.0% | +0.5% |
| Finance and Insurance | ~0.0% | +0.2% |
| Wholesale Trade | -0.3% | -1.4% |
| Public Administration | -0.3% | -0.8% |
| Utilities | +1.4% | -0.4% |
Source: Statistics Canada, Gross Domestic Product by Industry, August 2026. September and Q3 estimates are preliminary and subject to revision. Official results are scheduled for November 30.
Key Takeaways
- Canada's economy stalls for a second month: Real GDP was essentially unchanged in August after a flat July reading, missing market expectations for 0.2% growth.
- September estimate points to contraction: Statistics Canada projects a 0.1% monthly decline, driven by weakness in manufacturing and mining, quarrying, and oil and gas extraction.
- Q3 growth remains positive but momentum weakens: Preliminary industry data suggest GDP expanded 0.3% q/q, although the monthly pattern indicates subdued activity toward the end of the quarter.
- Retail trade rebounds strongly: Output increased 1.2% after a 1.1% decline in July, supported by motor vehicle dealers, food retailers and general merchandise stores.
- Manufacturing provides modest support: The sector expanded 0.3%, helped by machinery manufacturing (+3.8%) and petroleum refineries (+4.2%), despite weakness in motor vehicles and parts production.
- Wholesale trade is the largest drag: Output contracted 1.4%, led partly by a 4.4% decline among motor vehicle and parts wholesalers.
- Public administration weighs on activity: The sector declined 0.8%, partly reflecting the winding down of temporary Census-related operations.
- Oil and gas extraction continues to weaken: Output fell 1.2% in August, marking a third consecutive monthly decline, with maintenance activity contributing to lower oil sands production.
- Growth remains uneven across industries: Goods-producing industries increased 0.1%, but services-producing industries declined 0.1%, leaving aggregate GDP essentially flat.
- September's official release becomes important: The November 30 data will determine whether the estimated contraction and subdued Q3 growth are confirmed.
Eurozone GDP Beats Forecasts at 0.4%, but Germany Slows and France Contracts
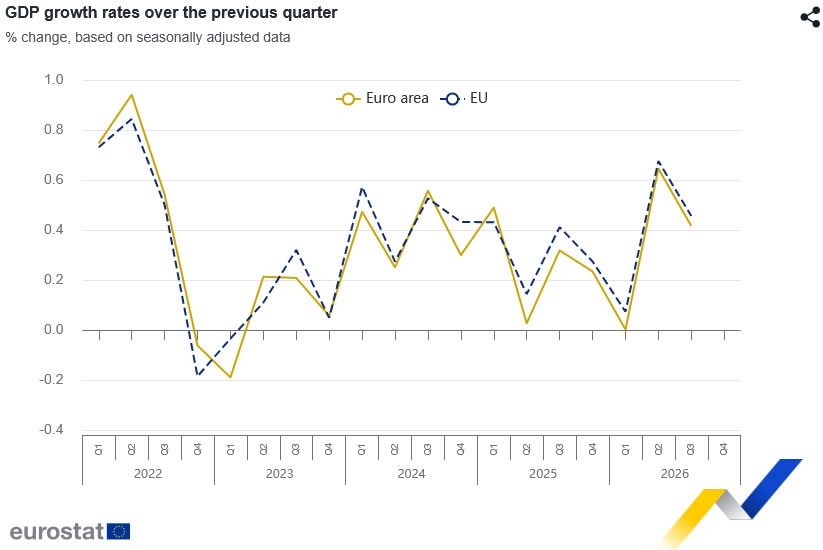
Eurozone GDP expanded 0.4% q/q in Q3, slowing from 0.6% in Q2 but beating market expectations of 0.2%, according to Eurostat's preliminary flash estimate. Annual growth edged up from 1.2% to 1.3%. The stronger-than-expected headline suggests that economic activity held up better than anticipated, although the slower quarterly pace and divergent performances among major economies point to an uneven expansion.
Germany's growth moderated from 0.3% to 0.2%, while France slipped from stagnation into a 0.1% contraction. Italy also lost momentum, with growth slowing from 0.2% to zero. In contrast, Spain continued to outperform, expanding 0.6% following 0.7% in Q2, while the Netherlands recorded the same quarterly growth rates. Ireland posted another exceptionally large increase of 5.5%, following 10.2% in Q2, although Eurostat cautioned that its preliminary estimate is experimental and based on incomplete data.
The figures present a mixed picture. Eurozone growth exceeded expectations, but the improvement was not broad-based, with Germany expanding only modestly and France and Italy showing little or no growth. Spain and the Netherlands provided a more resilient contrast, while Ireland's exceptional performance adds complexity to the regional aggregate. The release does not yet include an expenditure breakdown to identify the main sources of growth. With the flash estimate subject to revision, the immediate conclusion is that the Eurozone avoided a sharper-than-expected slowdown in Q3, rather than demonstrating a convincing acceleration across its major economies.
Data Summary
Eurozone Q3 GDP — Preliminary Flash Estimate, October 30, 2026
| Indicator | Q2 | Q3 | Cons |
|---|---|---|---|
| Eurozone GDP Q/Q | +0.6% | +0.4% | +0.2% |
| Eurozone GDP Y/Y | +1.2% | +1.3% | — |
| EU GDP Q/Q | +0.7% | +0.5% | — |
| EU GDP Y/Y | +1.4% | +1.5% | — |
Major Eurozone Economies — Quarterly GDP Growth
| Economy | Q2 | Q3 |
|---|---|---|
| Germany | +0.3% | +0.2% |
| France | 0.0% | -0.1% |
| Italy | +0.2% | 0.0% |
| Spain | +0.7% | +0.6% |
| Netherlands | +0.7% | +0.6% |
| Ireland | +10.2% | +5.5% |
Source: Eurostat, preliminary flash GDP estimate, October 30, 2026. Quarterly figures are seasonally adjusted. Estimates are subject to revision.
Key Takeaways
- Eurozone GDP beats expectations: The economy expanded 0.4% q/q in Q3, exceeding the 0.2% consensus forecast, although growth slowed from 0.6% in Q2.
- Annual growth improves marginally: Eurozone GDP growth edged up from 1.2% to 1.3% y/y, indicating continued expansion despite slower quarterly momentum.
- Germany's expansion remains modest: Quarterly growth moderated from 0.3% to 0.2%, offering limited evidence of a strong recovery in the region's largest economy.
- France contracts: GDP slipped from zero growth to -0.1% q/q, making France one of the few reporting economies to register a quarterly decline.
- Italy stagnates: Growth slowed from 0.2% to 0.0%, reinforcing the subdued picture across several major Eurozone economies.
- Spain and the Netherlands outperform: Both maintained relatively solid quarterly growth of 0.6%, following 0.7% in Q2, highlighting the uneven geographical distribution of economic momentum.
- Ireland records exceptional growth: GDP expanded 5.5% following a 10.2% increase in Q2. Eurostat cautioned that Ireland's preliminary estimate is experimental and based on incomplete information.
- Headline surprise does not signal broad-based acceleration: The stronger-than-expected result contrasts with slowing or stagnant activity in Germany, France and Italy.
- Preliminary figures warrant caution: Eurostat has not yet published a detailed expenditure breakdown, and estimates may be revised when the next release is published on November 13.
BoJ Holds at 1.25% as Underlying Inflation Reaches Target, Further Hikes Ahead
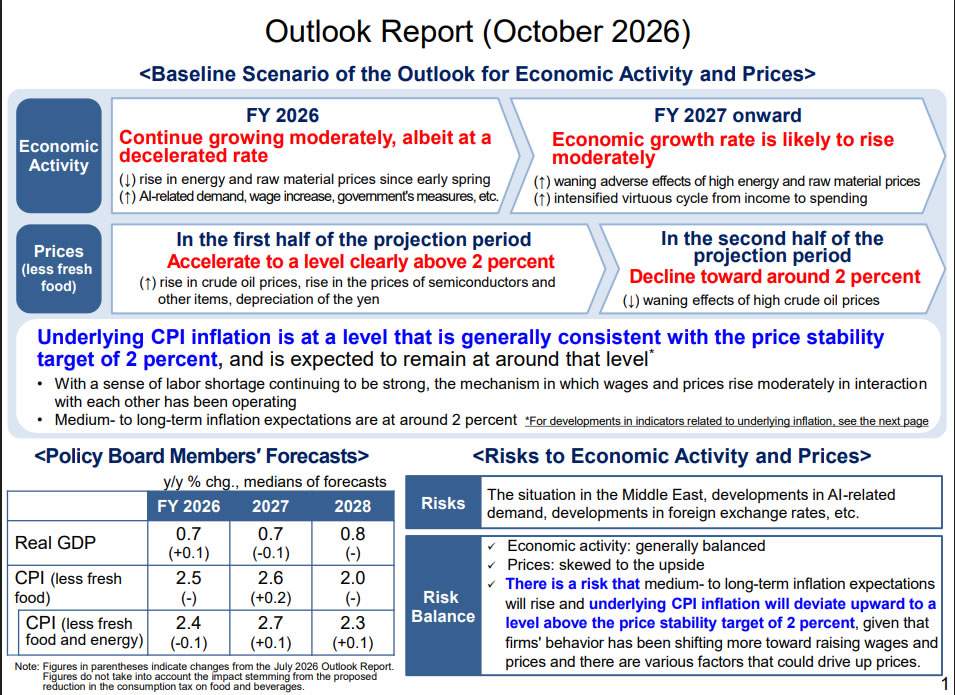
The Bank of Japan kept its policy rate unchanged at 1.25% by an 8–1 vote, with board member Hajime Takata dissenting in favour of an increase to 1.50%. Takata argued that underlying CPI inflation had reached the 2% price stability target and that the BoJ had entered a phase requiring faster adjustment of interest rates toward neutral. Although the majority opted to hold, the accompanying Outlook Report reinforced the case for further normalization, stating that underlying inflation is now at a level generally consistent with the 2% target. The decision therefore highlights a growing debate over the appropriate pace of tightening rather than whether monetary accommodation should eventually be reduced.
The BoJ also raised its FY2027 inflation forecasts while slightly lowering its growth outlook. Median core CPI inflation, excluding fresh food, was revised from 2.4% to 2.6%, while core-core inflation, excluding fresh food and energy, was raised from 2.6% to 2.7%. Meanwhile, projected GDP growth was lowered from 0.8% to 0.7%. The Bank expects higher crude oil prices, rising semiconductor and other goods prices, and Yen depreciation to push measured inflation clearly above 2% in the first half of its projection period, before moderating toward target later. It also warned that inflation risks are skewed to the upside, particularly if higher import costs and increasingly proactive corporate pricing behaviour lift medium- to long-term inflation expectations.
More importantly, the BoJ judges the underlying wage-price mechanism to be operating at a level consistent with sustainable 2% inflation. Persistent labour shortages have supported moderate wage increases and their transmission into consumer prices, while medium- to long-term inflation expectations have moved to around 2%. Despite previous policy-rate increases, the Bank considers financial conditions accommodative, with real interest rates and borrowing costs continuing to support economic activity. Against this backdrop, it reiterated that further rate hikes and reductions in monetary accommodation are appropriate if its economic and inflation projections materialize. The October hold therefore leaves the tightening direction intact, although the pace and timing will depend on incoming data and the evolving risks from energy prices, foreign exchange movements and global AI-related demand.
Separately, the BoJ unanimously decided to accelerate sales of its exchange-traded fund holdings from approximately ¥330B to ¥860B annually, beginning in January 2027. The new pace represents around 0.1% of stock-market trading value, compared with 0.05% previously, and would shorten the estimated disposal period from 112 years to approximately 43 years. The Bank said ETF sales had proceeded smoothly since January 2026, while expanding market turnover provided scope for a faster disposal pace without major disruption. It also retained the flexibility to adjust or suspend sales according to market conditions. The decision represents an additional step toward balance-sheet normalization, distinct from the unchanged policy-rate setting, and reinforces the broader process of gradually withdrawing extraordinary monetary accommodation.
Data Summary
Bank of Japan Monetary Policy Decision — October 30, 2026
| Item | Decision |
|---|---|
| Policy Rate | Held at 1.25% |
| Policy Board Vote | 8–1 |
| Dissenting Member | Hajime Takata |
| Dissenting Proposal | Raise policy rate to 1.50% |
| Underlying Inflation Assessment | Generally consistent with 2% target |
| Policy Outlook | Further rate hikes if economic and inflation forecasts materialize |
| Inflation Risk Balance | Skewed to the upside |
BoJ Economic Projections — October 2026 Outlook Report
Median forecasts, fiscal years; July → October 2026
| Indicator | FY2026 | FY2027 | FY2028 |
|---|---|---|---|
| Real GDP | 0.6% → 0.7% | 0.8% → 0.7% | 0.8% → 0.8% |
| Core CPI | 2.5% → 2.5% | 2.4% → 2.6% | 2.0% → 2.0% |
| Core-Core CPI | 2.5% → 2.4% | 2.6% → 2.7% | 2.2% → 2.3% |
Forecasts exclude the impact of the proposed reduction in consumption tax on food and beverages.
ETF Disposal Programme
| Indicator | Previous | New Plan |
|---|---|---|
| Annual ETF Sales (Book Value) | ¥330B | ¥860B |
| Share of Stock-Market Trading Value | ~0.05% | ~0.10% |
| Estimated Disposal Period | ~112 years | ~43 years |
| Implementation | — | January 2027 |
The new annual sales pace corresponds to approximately ¥2.46 trillion in market value, based on the BoJ's valuation estimate. The Bank retains flexibility to adjust or suspend sales in response to financial-market conditions.
Sources: Bank of Japan, October 30, 2026 Statement on Monetary Policy; October 2026 Outlook for Economic Activity and Prices; and Decision Regarding the Pace of ETF Sales.
Key Takeaways
- BoJ holds rates with one hawkish dissent: The policy rate stays at 1.25% following an 8–1 vote. Hajime Takata proposed an immediate increase to 1.50%, arguing that underlying inflation had reached target and monetary normalization should proceed more quickly.
- Underlying inflation is judged broadly consistent with 2%: The BoJ assesses that Japan's underlying inflation has reached a level generally consistent with its price-stability objective, supported by persistent labour shortages, wage-price interaction and longer-term inflation expectations around 2%.
- FY2027 inflation outlook is upgraded: Core CPI inflation is revised from 2.4% to 2.6%, while core-core inflation rises from 2.6% to 2.7%. Meanwhile, projected GDP growth is reduced from 0.8% to 0.7%.
- Energy costs and Yen depreciation drive additional price pressure: Higher crude oil prices, rising semiconductor costs and Yen weakness are expected to push measured inflation clearly above 2% before pressures ease later in the projection period.
- Inflation risks are skewed upward: The BoJ warns that more active corporate wage and price-setting behaviour could lift medium- to long-term inflation expectations and push underlying inflation above target.
- Financial conditions remain accommodative: Despite previous rate increases, the Bank judges borrowing conditions and real interest rates to be supportive of economic activity, leaving scope for further normalization.
- Further rate increases remain the baseline policy direction: The BoJ reiterates its intention to raise rates and reduce monetary accommodation if the economy and inflation evolve in line with its projections, without committing to a specific timetable.
- Growth outlook faces competing forces: Higher energy and raw-material costs are expected to constrain household purchasing power and corporate profits, while global AI-related demand, wage increases and government measures provide support.
- ETF sales accelerate substantially: The Bank unanimously increases planned annual ETF disposals from ¥330B to ¥860B, beginning January 2027, shortening the estimated disposal period from 112 years to 43 years.
- Normalization continues despite the rate hold: The combination of a sustained tightening bias and faster ETF disposal indicates continued withdrawal of monetary accommodation, while the majority favours a gradual approach to interest-rate adjustments.
Full BoJ statement, Outlook for Economic Activity and Prices.