
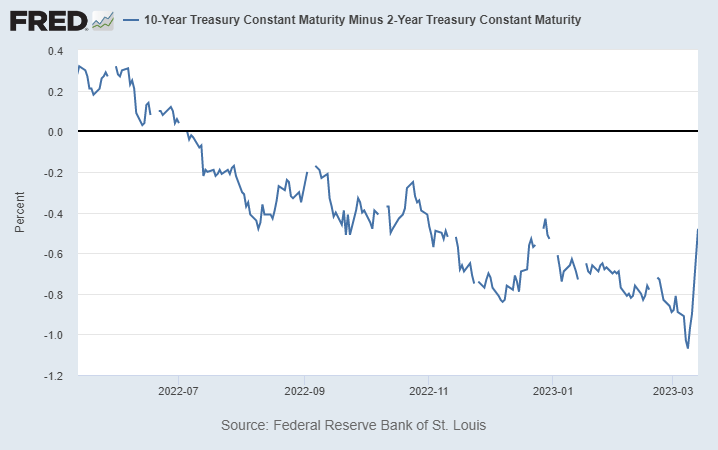
US yield curve inversion unwinding quickly, imminent recession concerns US Treasury yield has experienced a significant decline as funds continue to pour into bonds due to the collapse of Silicon Valley Bank. Overnight, the 2-year yield dropped by -0.585 to 4.030, after breaching the 4% handle. This is the worst one-day drop since the 2008 global financial crisis. The yield fell by nearly 100 basis points from Wednesday’s 5.066, which was the most significant three-day decline since the 1987 market crash.
However, an even more critical development is the rapid unwinding of the yield curve inversion. Last week, the 10-year yield was more than 100 basis points below the 2-year yield. But now, it’s around 50 basis points below. It’s still too early to tell if the yield curve is normalizing, but recent history suggests that a recession in the US is imminent if that is the case.
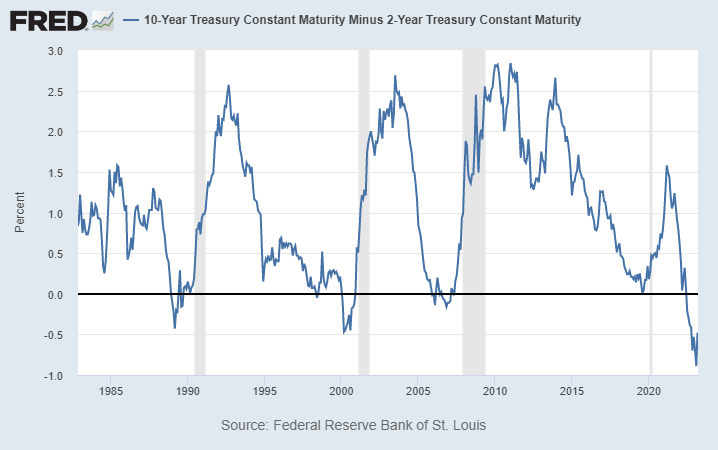
In the first example, for the 1988/90 inversion period, yield curve can be considered fully normalized in April 1990. Recession officially began in July 1990, three months later.
In the second example, for the 2000 inversion period, yield curve can be considered fully normalized in January 2001, and recession started in March 2001, three months later.
In the third example, for the 2006/2007 inversion period, yield curve can be considered fully normalized in June 2007. Recession officially started in December, six months later.


