
Equity markets may initially react positively if the Federal Reserve delivers a more neutral hold than expected, as outlined in our Fed analysis. A softer tone could ease rate concerns and lift risk sentiment in the short term. However, the sustainability of any such rebound remains highly uncertain given the underlying technical structure.
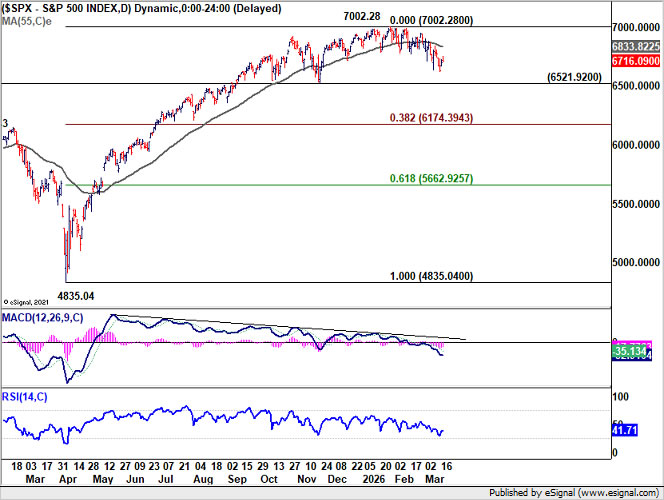
Technically, S&P 500 has been spiraling lower since peaking at 7,002.28 record in January. Any rebound triggered by the Fed is likely to face strong resistance at the 55 D EMA (now at 6833.82). As long as price action remains capped below this level, rallies should be viewed as temporary recovery only.
The key level to watch on the downside is 6,521.92. A firm break of this structural support would confirm that the index has formed a medium-term top at 7,002.28, on persistent bearish divergence in D MACD. S&P 500 should then be already in correction to the whole rise from 4835.04 (2025 low).
The next target comes in at 38.2% retracement of 4,835.04 to 7,002.28 at 6,174.39. A move toward this level would likely coincide with renewed Dollar strength, as equity weakness feeds back into broader risk sentiment across global markets.


