
Bitcoin has found surprising stability in an environment that has been anything but supportive. In March, as the Iran War drove a sharp rally in oil prices and intensified inflation risks, most risk assets struggled under tightening financial conditions. Yet Bitcoin held steady in range above 60k, signaling that a structural “demand floor” has already taken shape.
That floor appears to have formed around the 60k region, underpinned by a decisive shift in flows. March recorded USD 1.32 billion in ETF-driven inflows, snapping a four-month streak of withdrawals. Institutional players effectively treated the war-driven dip as a strategic accumulation opportunity, stepping in aggressively at lower levels.
At the same time, the supply side showed clear signs of fatigue. The market had already absorbed two major waves of liquidation—from 126k (Oct) to 80k (Nov), and then from 98k (Jan) to 60k (Feb). This sequence points to broad seller exhaustion, with weak hands largely flushed out and downside momentum losing traction.
Technically, in the near term, the 70k level stands as the key breakout trigger. A firm move above this psychological level, particularly alongside a sustained break of 55 D EMA (now at 70,959) would signal that the pattern from 59,866 low is extending with another another upleg. Such a development would open the path toward 76k resistance and potentially extend further.
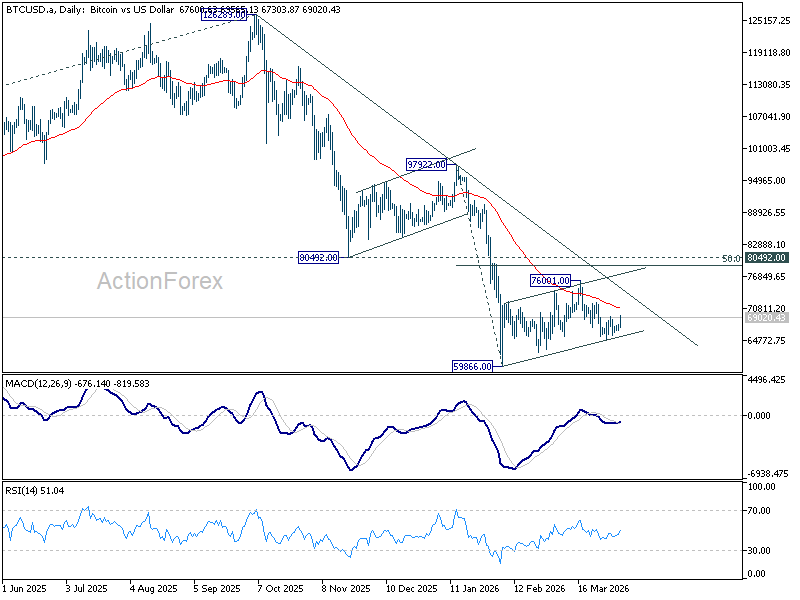
However, the structure of the pattern so far suggests that it’s merely a consolidation phase within the larger down trend from 126,289. Hence, upside should be constrained by a clearly defined ceiling.
The zone between the 50% retracement of 97,922 to 59,866 at 78,894 and the 80,492 support-turned-resistance marks a significant institutional distribution zone. This area aligns closely with the 80k level, forming a well-defined “supply wall” where large-scale profit-taking is likely to emerge.
The macro backdrop reinforces this floor vs ceiling contrast. While ETF flows and positioning support the downside, Bitcoin continues to face non-yielding asset pressure amid higher-for-longer Fed expectations. Rising real yields and the fading prospect of rate cuts limit the scope for sustained upside, even as demand stabilizes.
In this context, Bitcoin’s current setup reflects balance rather than breakout. A durable floor has been established near 60k, but a decisive shift in macro conditions would be needed to clear the 80k ceiling. Until then, price action is likely to remain defined by range dynamics, with rallies capped and dips supported.


