
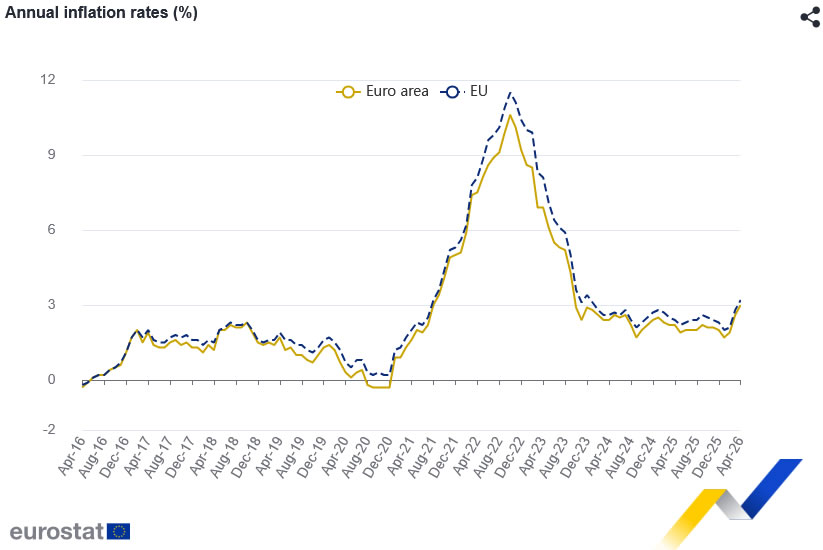
Eurozone inflation accelerated in April as rising energy prices pushed headline CPI higher, though underlying core inflation pressures eased modestly. Final data showed Eurozone CPI rose from 2.6% yoy to 3.0% yoy. Core CPI, excluding energy, food, alcohol and tobacco, slowed slightly from 2.3% yoy to 2.2% yoy.
The rebound in headline inflation was driven primarily by energy and services. Services contributed the largest share to annual inflation at 1.38 percentage points, followed by energy at 0.99 percentage points. Food, alcohol and tobacco added 0.46 percentage points, while non-energy industrial goods contributed 0.20 percentage points. The data reinforce the impact of higher global energy prices linked to the Middle East conflict, even as broader domestic price pressures show some signs of stabilization.
Across the broader European Union, annual inflation was finalized at 3.2% yoy. Inflation pressures remained uneven across the region. Sweden recorded the lowest annual inflation rate at 0.5%, followed by Denmark at 1.2% and Czechia at 2.1%. At the other end, Romania posted the highest inflation rate at 9.5%, ahead of Bulgaria at 6.0% and Croatia at 5.4%. Compared with March, inflation fell in only five EU member states while rising in twenty-one, highlighting the broadening nature of price pressures across Europe.
Eurozone CPI Summary — April 2026:
| Indicator | Previous | Latest |
|---|---|---|
| Eurozone CPI (yoy) | 2.6% | 3.0% |
| Eurozone Core CPI (yoy) | 2.3% | 2.2% |
| EU CPI (yoy) | 2.8% | 3.2% |
Contributions to Eurozone Inflation:
| Component | Contribution (pp) |
|---|---|
| Services | 1.38 |
| Energy | 0.99 |
| Food, Alcohol & Tobacco | 0.46 |
| Non-Energy Industrial Goods | 0.20 |


