


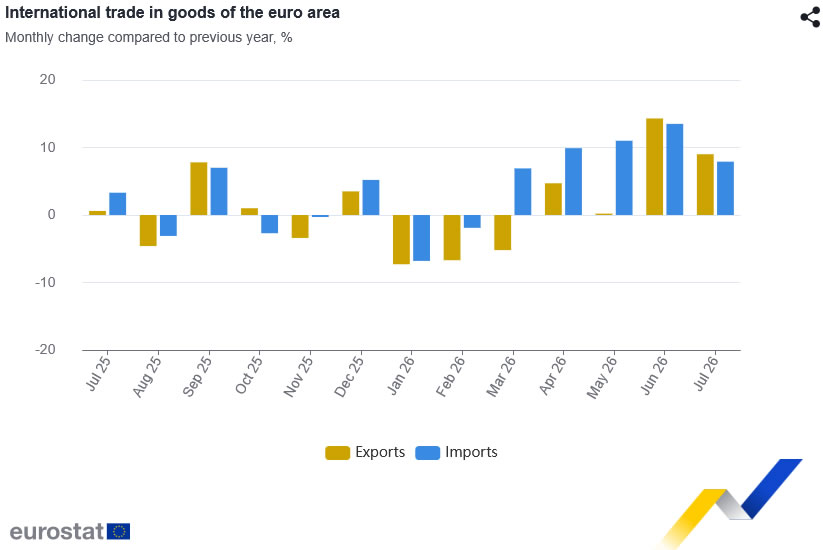
The Eurozone’s seasonally adjusted trade surplus widened from a revised €1.0bn in June to €5.0bn in July, exceeding the €2.5bn market expectation. Exports increased 1.2% month on month from €257.7bn to €260.8bn, while imports fell 0.4% from €256.7bn to €255.7bn. The EU also improved at the margin: its trade deficit narrowed from €5.9bn to €1.4bn, as exports rose 1.2% and imports declined 0.7%.
The unadjusted figures confirmed July’s improvement but exposed a much weaker year-to-date position. The Eurozone surplus rose from €7.2bn in June to €14.2bn in July, above the €10.7bn recorded a year earlier. However, its cumulative surplus for January to July collapsed from €92.8bn in 2025 to €17.0bn in 2026, as imports increased 5.8% while exports grew only 1.2%. The EU’s July surplus increased from €2.4bn to €8.0bn, but remained below €9.8bn a year earlier. Across January to July, the EU swung from an €84.0bn surplus to a €13.8bn deficit, with imports rising 5.9% as exports fell 0.6%.
The composition explains why July should be treated as monthly relief rather than a reversal of the broader deterioration. The EU’s machinery-and-vehicles surplus narrowed from €20.6bn a year earlier to €12.2bn, while its energy deficit widened from €26.1bn to €28.0bn. By trading partner, the surplus with the United States expanded from €12.6bn to €17.9bn, but the deficit with China deepened from €32.3bn to €36.5bn. Europe’s external trade position therefore improved in July, but the cumulative loss of its trade cushion remains the more consequential signal.
Data Summary
Seasonally Adjusted Monthly Data
| Indicator (€bn) | July | June |
|---|---|---|
| Eurozone trade balance | 5.0 | 1.0 |
| Eurozone exports | 260.8 | 257.7 |
| Eurozone imports | 255.7 | 256.7 |
| EU trade balance | -1.4 | -5.9 |
| EU exports | 231.0 | 228.2 |
| EU imports | 232.4 | 234.1 |
Non-Seasonally Adjusted Year-to-Date Data
| Indicator (€bn) | Jan–Jul 2026 | Jan–Jul 2025 |
|---|---|---|
| Eurozone trade balance | 17.0 | 92.8 |
| Eurozone exports | 1,763.6 | 1,743.4 |
| Eurozone imports | 1,746.6 | 1,650.6 |
| EU trade balance | -13.8 | 84.0 |
| EU exports | 1,565.1 | 1,575.3 |
| EU imports | 1,578.9 | 1,491.3 |
Key Takeaways
- The Eurozone’s seasonally adjusted surplus widened from €1.0bn to €5.0bn in July, exceeding the €2.5bn market expectation.
- June’s Eurozone balance was revised to €1.0bn, compared with the €1.8bn previously shown on the economic calendar.
- Eurozone exports rose 1.2% month on month, while imports fell 0.4%, confirming a genuine improvement during July.
- The EU trade deficit narrowed from €5.9bn to €1.4bn, supported by a 1.2% increase in exports and a 0.7% decline in imports.
- The monthly improvement contrasts with a sharp year-to-date deterioration: the Eurozone’s January–July surplus fell from €92.8bn to €17.0bn.
- The EU swung from an €84.0bn surplus to a €13.8bn deficit over the same seven-month period.
- Europe’s cumulative trade position weakened because imports grew considerably faster than exports.
- A smaller machinery-and-vehicles surplus, a wider energy deficit and a deeper trade deficit with China remained important structural pressures.





