


The US goods trade deficit widened from a revised $132.1B to $134.9B in September, exceeding market expectations of $128.7B, according to advance estimates from the Census Bureau. August’s deficit was revised down from the initially reported $136.6B. Goods exports increased 2.6% m/m, or $5.3B, to $209.2B, while imports rose 2.4%, or $8.1B, to $344.1B. The $2.8B deterioration in the trade balance therefore reflected a larger increase in imports than exports, rather than an outright decline in US export activity.
Capital goods imports were the principal driver of the widening deficit, jumping 7.5% m/m, or approximately $10.9B, from $146.4B to $157.4B. This increase exceeded the $8.1B overall rise in goods imports, as other categories provided significant offsets. Industrial supplies imports fell 6.0%, while automotive imports declined 4.0%. On the export side, capital goods shipments increased 5.4% to $73.3B, alongside gains in consumer goods and food exports. However, these increases were insufficient to offset the surge in capital goods imports, leaving the capital goods trade deficit approximately $7.2B wider.
The composition suggests that September’s trade deterioration was concentrated in imported capital goods rather than broad-based import growth or weakening overall exports. While stronger capital goods imports may be consistent with demand for investment-related equipment, the advance figures do not identify the specific industries or activities responsible. The wider deficit could also have implications for the external trade contribution to Q3 GDP, but the data cover goods only and are not adjusted for price changes, limiting direct conclusions about real economic growth. The accompanying report showed wholesale inventories rising 0.6% m/m, slightly above expectations of 0.5%, adding another consideration for assessing the broader quarterly growth picture.
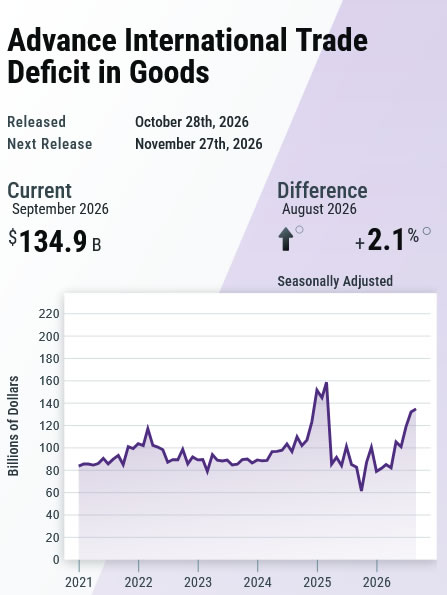
Data Summary
US Advance International Trade in Goods — September 2026
| Indicator | Aug | Sep | Change |
|---|---|---|---|
| Goods Trade Balance | -$132.1B | -$134.9B | -$2.8B |
| Goods Exports | $204.0B | $209.2B | +$5.3B (+2.6%) |
| Goods Imports | $336.0B | $344.1B | +$8.1B (+2.4%) |
Headline consensus: -$128.7B, compared with the actual -$134.9B, representing a $6.2B wider deficit than expected.
August revision: The previously reported deficit of $136.6B was revised to $132.1B.
Selected Trade Categories — August → September 2026
| Category | Exports | Imports |
|---|---|---|
| Capital Goods | $69.5B → $73.3B (+5.4%) | $146.4B → $157.4B (+7.5%) |
| Consumer Goods | $20.9B → $22.2B (+6.5%) | $57.5B → $59.3B (+3.1%) |
| Industrial Supplies | $77.8B → $76.5B (-1.6%) | $62.7B → $58.9B (-6.0%) |
| Automotive Goods | $12.6B → $11.9B (-5.6%) | $35.7B → $34.3B (-4.0%) |
| Foods, Feeds and Beverages | $14.2B → $16.0B (+12.8%) | $18.6B → $18.1B (-2.5%) |
Accompanying Inventory Data
- Wholesale inventories: +0.5% → +0.6% m/m, above consensus of +0.5%.
- Retail inventories: +0.3% → +0.3% m/m.
Source: US Census Bureau, Monthly Advance Economic Indicators Report, September 2026. Trade figures are seasonally adjusted, Census-basis estimates and are not adjusted for price changes.
Key Takeaways
- Goods trade deficit widens more than expected: The deficit increased from a revised $132.1B to $134.9B in September, exceeding the expected $128.7B deficit by $6.2B.
- Imports outpace exports in dollar terms: Goods exports rose 2.6% to $209.2B, while imports increased 2.4% to $344.1B. The larger dollar increase in imports drove the $2.8B deterioration.
- Capital goods imports dominate the increase: Imports of capital goods surged 7.5%, or approximately $10.9B, to $157.4B, exceeding the $8.1B overall increase in goods imports.
- Capital goods trade deficit widens sharply: Although capital goods exports increased 5.4% to $73.3B, the larger rise in imports widened the category’s trade deficit by approximately $7.2B.
- Other import categories provide offsets: Industrial supplies imports declined 6.0%, while automotive imports fell 4.0%, indicating that September’s import growth was concentrated rather than broad-based.
- Exports show mixed but generally positive performance: Capital goods, consumer goods and food exports increased, while industrial supplies and automotive exports declined. The wider deficit did not result from an outright contraction in total exports.
- Inventory accumulation continues: Wholesale inventories increased 0.6% m/m, slightly exceeding forecasts of 0.5%, while retail inventories rose 0.3%.
- GDP implications require caution: The wider deficit could affect assessments of Q3 net exports, but the advance figures cover nominal goods trade only. They do not directly establish the contribution of inflation-adjusted net exports to real GDP.