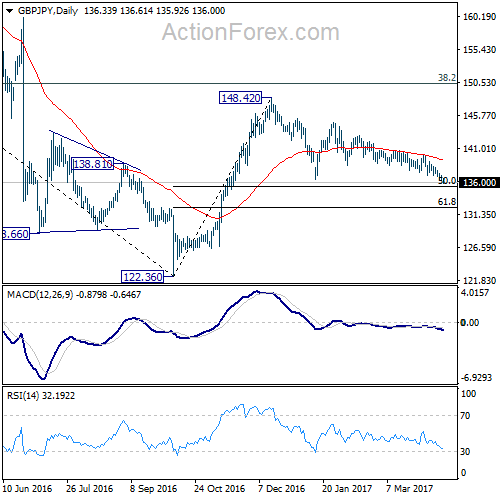
GBP/JPY’s choppy fall from 144.77 extended last week and reached as low as 135.99. Such decline is expected to continue to medium term fibonacci level at 135.29. At this point, since we’re viewing price actions from 148.42 as a corrective pattern. We’ll look for support from 135.29 to contain downside and bring rebound.
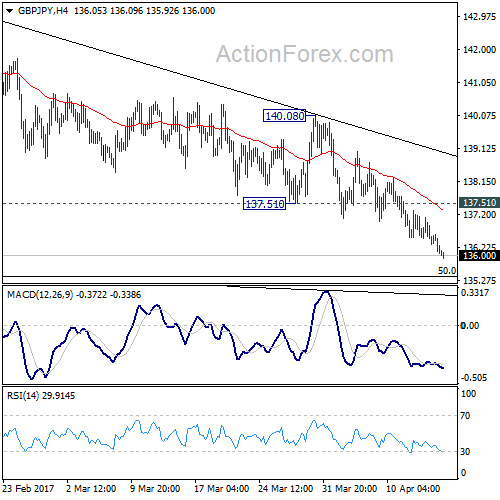
Initial bias in GBP/JPY remains on the downside tis week for medium term fibonacci level at 135.39. We’d anticipate strong support from there to bring rebound. On the upside, break of 137.51 support turned resistance will turn intraday bias back to the upside. Break of 140.08 resistance will confirm near term reversal. However, sustained break of 135.39 will dampen our view and target next fibonacci level at 132.31.
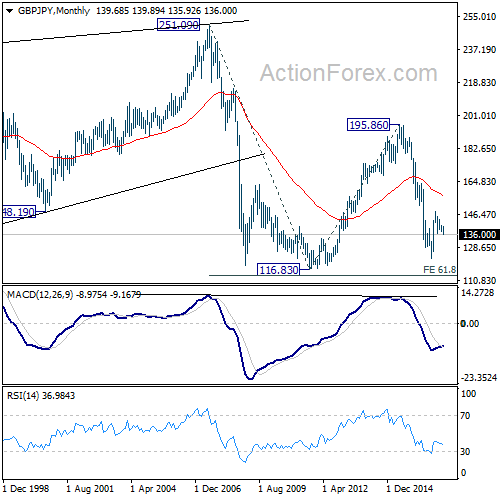
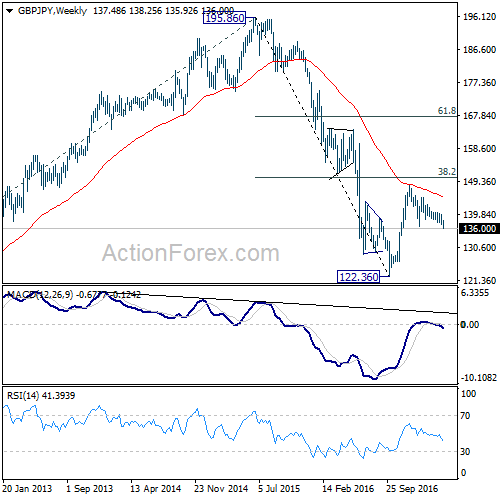
In the bigger picture, price actions from 122.36 medium term bottom are still seen as a corrective pattern. As long as 50% retracement of 122.36 to 148.42 at 135.39 holds, another rising leg would be seen to 38.2% retracement of 195.86 to 122.36 at 150.42 and possibly above. However, firm break of 135.39 will bring retest of 122.36, with prospect of resuming the larger down trend from 195.86.
In the longer term picture, while price actions from 122.36 would develop into a medium term correction, fall from 195.86 is still seen as resuming the down trend from 251.09 (2007 high). Hence, after the correction from 122.36 completes we’d expect another fall through 116.83 low.