
GBP/JPY rose sharply to as high as 144.48 last week. The development should have confirmed our view that consolidation pattern from 148.42 has completed at 135.58, ahead of 135.39 medium term fibonacci level. Further rise should be seen through 148.42 ahead.
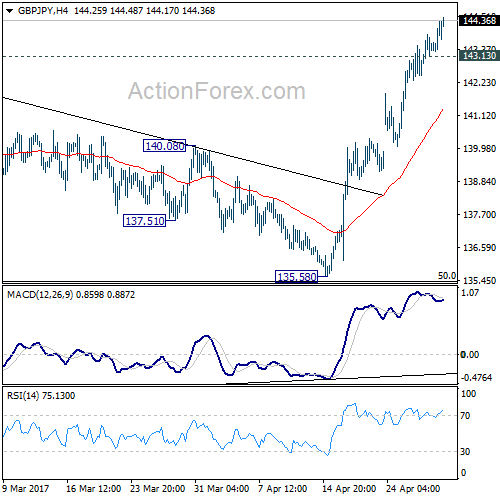
Initial bias in GBP/JPY remains on the upside this week. Break of 144.77 resistance will likely resume the whole rebound from 122.36 through 148.42 resistance. On the downside, break of 143.13 minor support will turn bias neutral and bring consolidation before staging another rally.
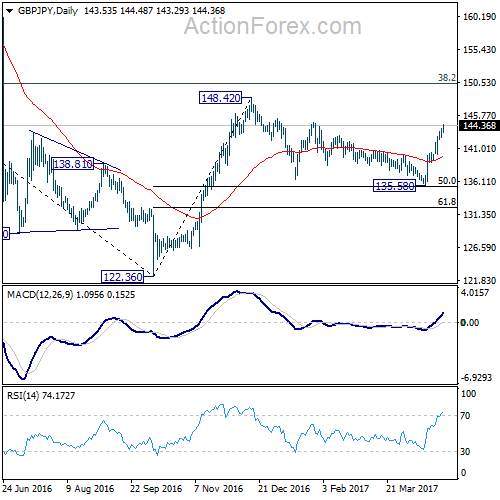
In the bigger picture, based on current momentum, rise from 122.36 bottom should be developing into a medium term move. Break of 38.2% retracement of 195.86 to 122.36 at 150.42 should pave the way to 61.8% retracement at 167.78. This will now be the favored case as long as 135.58 support holds.
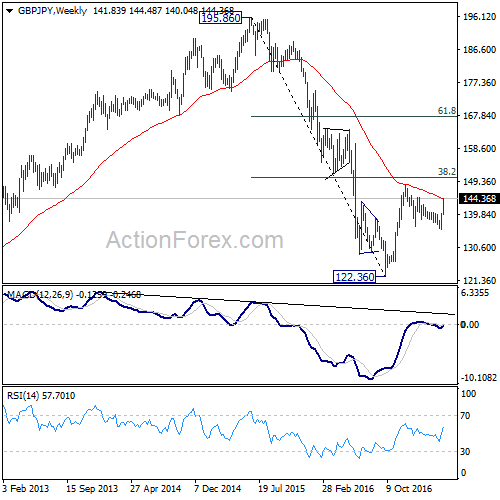
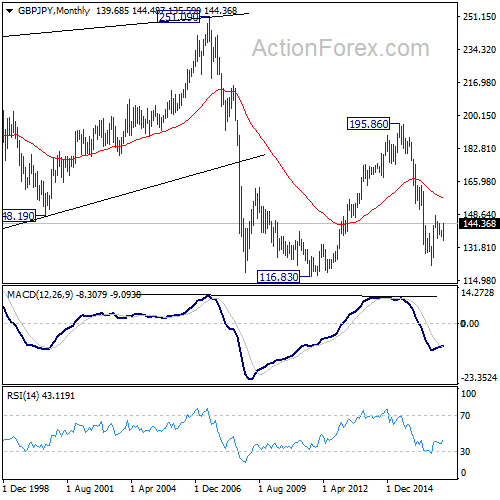
In the longer term picture, based on the impulsive structure of the decline from 195.86 to 122.36, such fall should be completed yet. But we will now pay close attention to the structure of the rise from 122.36 to determine whether it’s a corrective move, or an impulsive move. That would decide whether a break of 116.83 low would be seen.


