
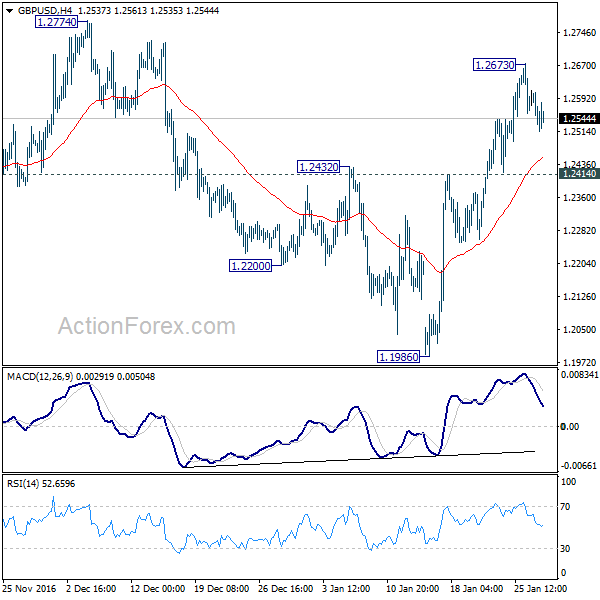
GBP/USD rose further to as high as 1.2673 last week but lost momentum since then. Initial bias stays neutral this week first. Rise from 1.1986 is seen as the third leg of the consolidation pattern from 1.1946. Hence, in case of another rise, we’d expect strong resistance at 1.2774 to limit upside and bring down trend resumption eventually. On the downside, break of 1.2414 will argue that rise from 1.1986 is completed and turn bias to the downside for 1.1946 low.
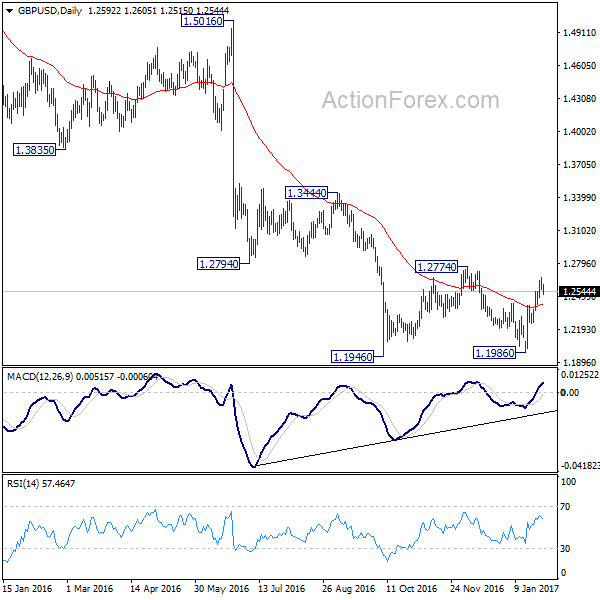
In the bigger picture, fall from 1.7190 is seen as part of the down trend from 2.1161. There is no sign of medium term bottoming yet. Sustained trading below 61.8% projection of 2.1161 to 1.3503 from 1.7190 at 1.2457 will target 100% projection at 0.9532. Overall, break of 1.3444 resistance is needed to confirm medium term bottoming. Otherwise, outlook will remain bearish.
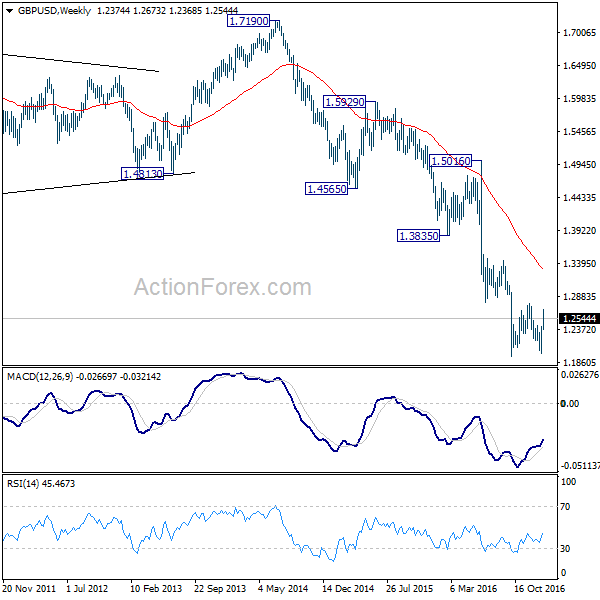
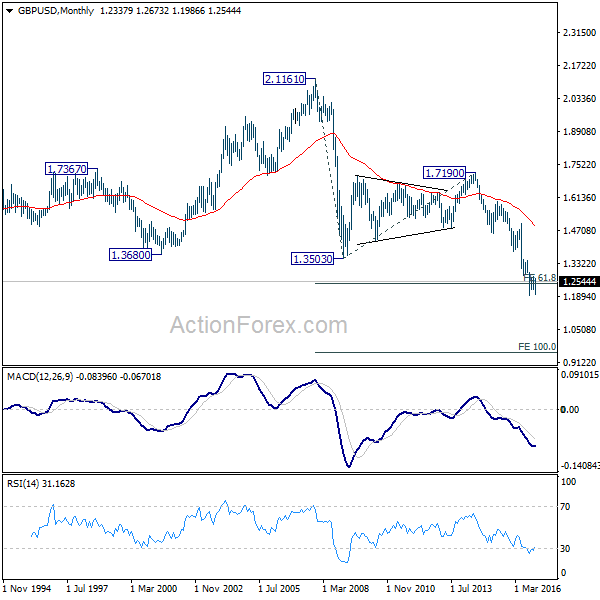
In the longer term picture, no change in the view that down trend from 2.1161 is still in progress. Current momentum suggests that the down trend will go deeper than originally expected.
Subscribe to our daily and mid-day newsletter to get this report delivered to your mail box


