GBP/USD dropped further to as low as 1.2133 last week but lost some downside momentum. Mild bullish convergence condition is seen in 4 hour MACD. Some consolidations could be seen this week first but overall outlook is unchanged. That is consolidation pattern from 1.1946 is completed at 1.2705 and fall from there would break through 1.1946 low eventually to resume the larger down trend.
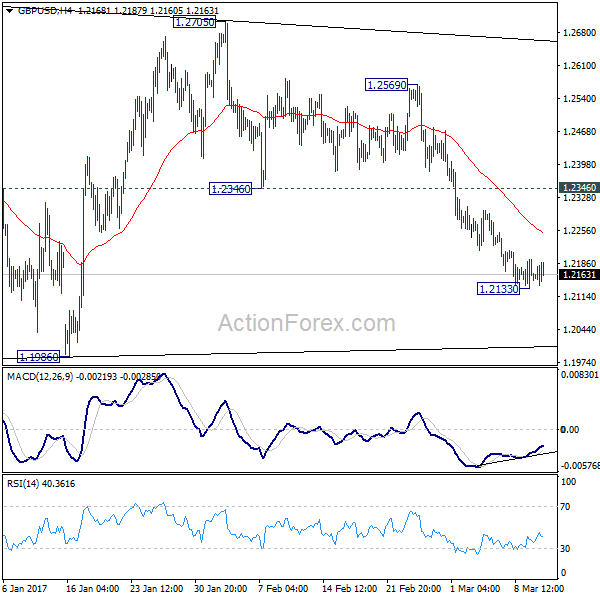
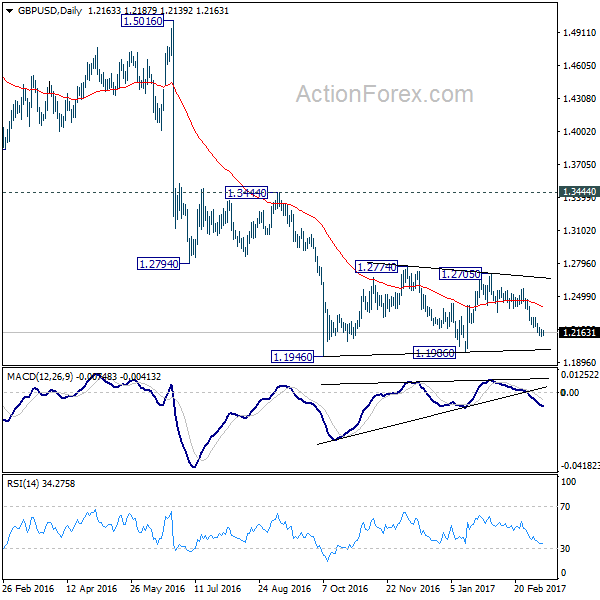
Initial bias in GBP/USD is neutral this week first for consolidations. Upside of recovery should be limited by 1.2346 support turned resistance and bring fall resumption. Below 1.2133 will turn bias to the downside for retesting 1.1946/86 support zone. Break of 1.1946 will confirm our bearish view and resume the larger down trend.
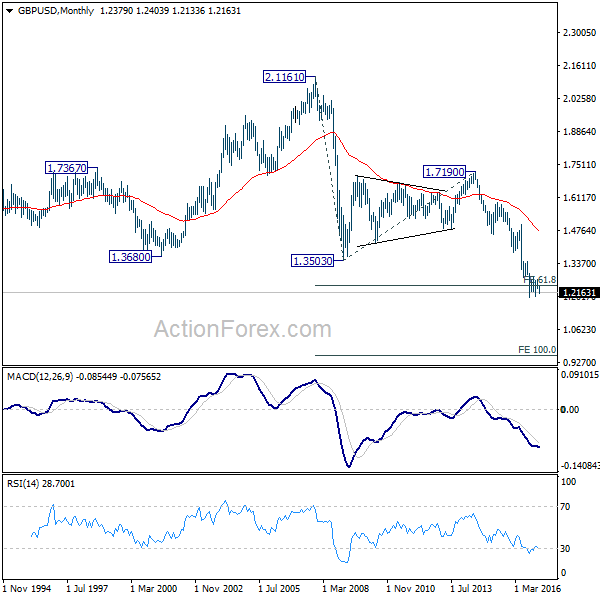
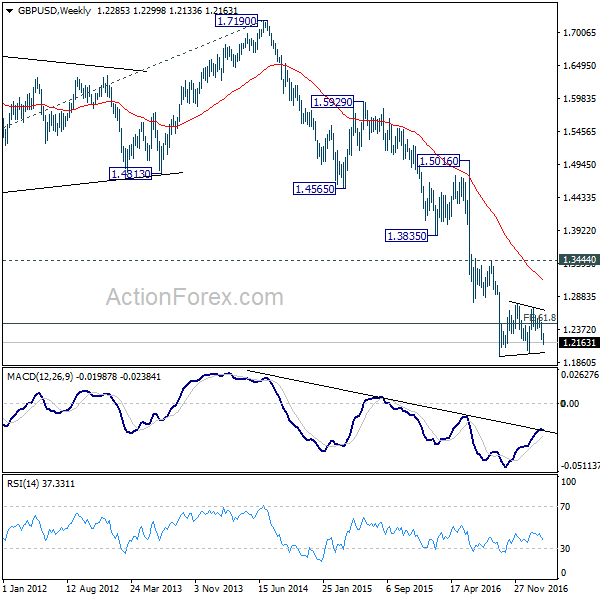
In the bigger picture, fall from 1.7190 is seen as part of the down trend from 2.1161. There is no sign of medium term bottoming yet. Sustained trading below 61.8% projection of 2.1161 to 1.3503 from 1.7190 at 1.2457 will target 100% projection at 0.9532. Overall, break of 1.3444 resistance is needed to confirm medium term bottoming. Otherwise, outlook will remain bearish.
In the longer term picture, no change in the view that down trend from 2.1161 is still in progress. Current momentum suggests that the down trend will go deeper than originally expected to 100% projection of 2.1161 to 1.3503 from 1.7190 at 0.9532.