
USD/CAD edged lower to 1.3263 last week and then drew support from 55 day EMA and recovered. Subsequent recovery was relatively weak as it was limited by 1.3408. Overall development is unchanged though. Fall from 1.3534 is seen as a correction only. Rise from 1.2968 is expected to resume later to extend through the whole medium term rise from 1.2460 through 1.3598.
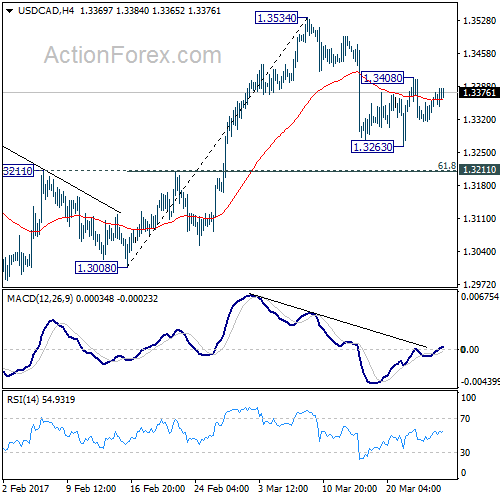
Initial bias is neutral this week first. On the upside, above 1.3408 will turn bias to the upside for 1.3534. Break will target 1.3598 high next. On the downside, below 1.3263 will extend the fall from 1.3534. But in that case, we’d expect strong support from 1.3211 cluster level (61.8% retracement of 1.3008 to 1.3534 at 1.3209) to contain downside and bring rebound.
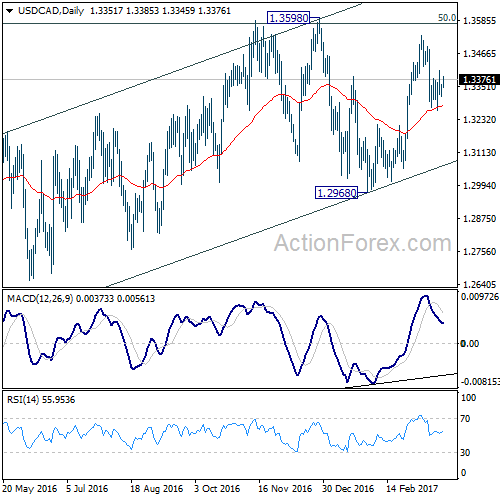
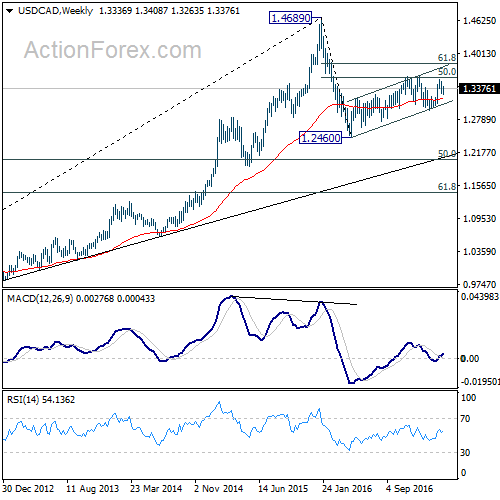
In the bigger picture, price actions from 1.4689 medium term top are seen as a correction pattern. The first leg has completed at 1.2460. The second leg is likely still in progress and could target 61.8% retracement of 1.4689 to 1.2460 at 1.3838. We’d look for reversal signal there to start the third leg. Break of 1.2968 wold at least bring at retest of 1.2460 low. However, sustained trading above 1.3838 would pave the way to retest 1.4689 high.
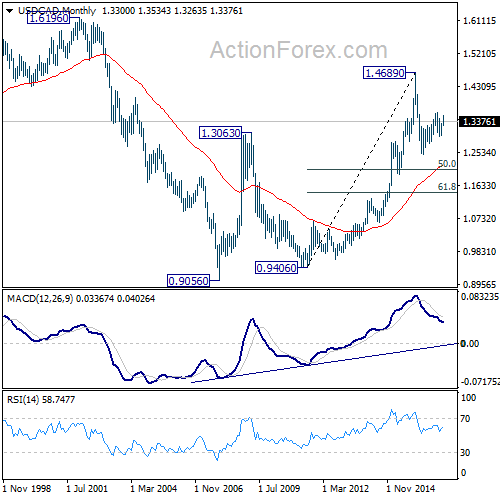
In the longer term picture, rise from 0.9056 (2007 low) is viewed as a long term up trend. It’s taking a breath after hitting 1.4689. But such rise expected to resume later to test 1.6196 down the road.


