
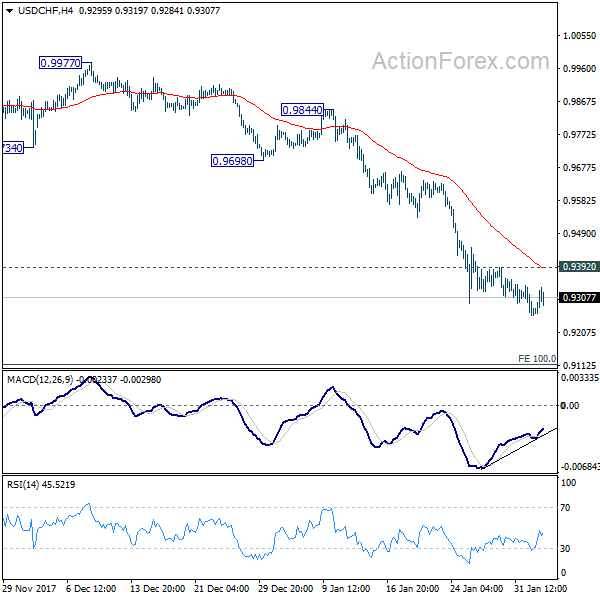
USD/CHF’s decline extended to 0.9254 last week. Downside momentum is diminishing as seen in 4 hour MACD. But as long as 0.9392 resistance holds, deeper fall is expected. Current fall from 1.0037 would target next fibonacci projection level at 0.9115. On the upside, break of 0.9392 minor resistance, however, will indicate short term bottoming and bring stronger rebound.
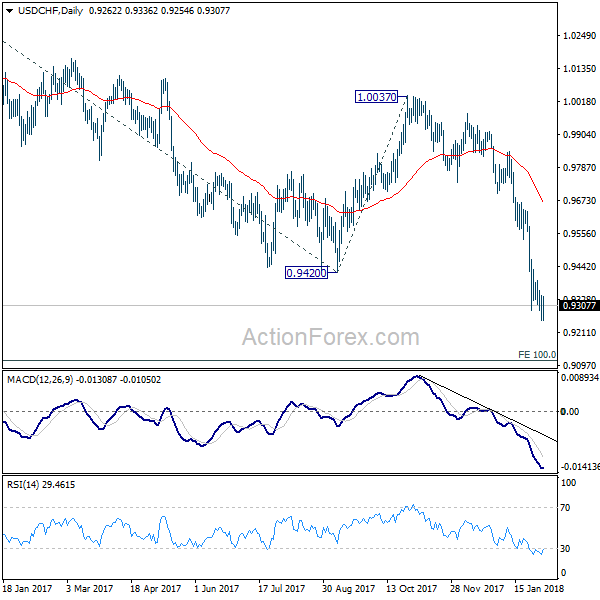
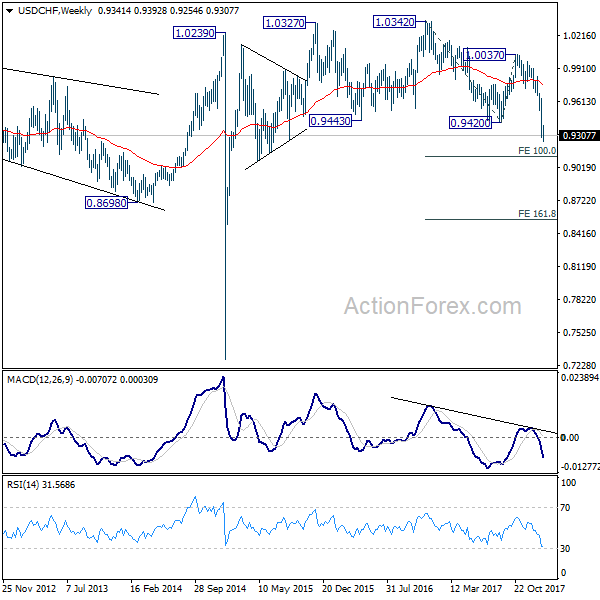
In the bigger picture, the strong break of 0.9420 support suggests that fall from 1.0342 is developing into a medium term down trend. Deeper fall should be seen to 100% projection of 1.0342 to 0.9420 from 1.0037 at 0.9115. Break will target 161.8% projection at 0.8545. In any case, break of 0.9640 resistance is needed to be the first sign of medium term bottoming. Otherwise, outlook will stay bearish even in case of strong rebound.
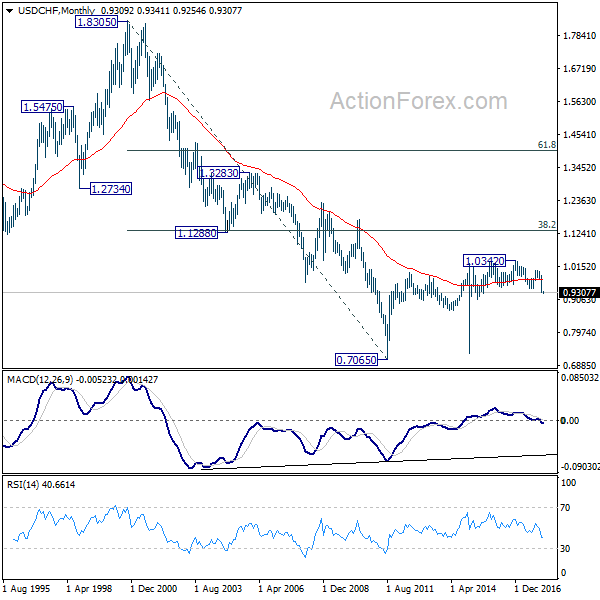
In the long term picture, the strong break of 0.9420 support and downside acceleration turns the long term outlook rather bearish. Corrective rebound from 0.7065 (2011 low) could have already completed at 1.0342. 0.8698 support will be a key level to watch. Sustained break there could bring retest of 0.7065.


