
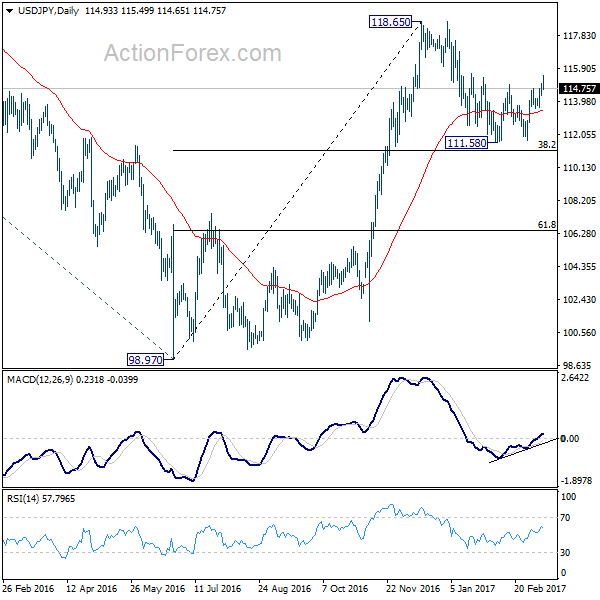
USD/JPY jumped to as high as 115.49 last week but formed a temporary top there and retreated. The break of 114.94 resistance indicates completion of corrective fall from 118.65, with a double bottom pattern (111.58, 111.68). Hence, while some consolidation could be seen this week. Another rise is expected later to retest 118.65 high.
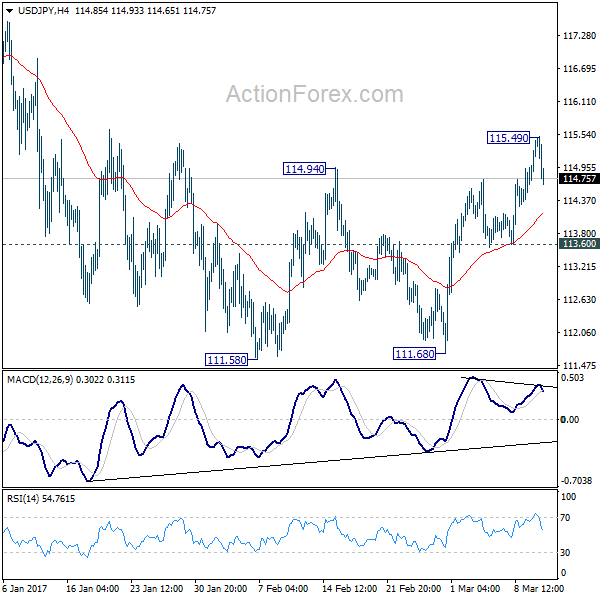
Initial bias in USD/JPY is neutral this week for consolidations. Downside of retreat should be contained by 113.60 support and bring another rally. Above 115.49 will turn bias to the upside to target a test on 118.65. decisive break there will extend whole rise from 98.97 and target 125.85 high next. However, break of 113.60 will invalidate our view and turn bias back to the downside for 111.58/68 support zone instead.
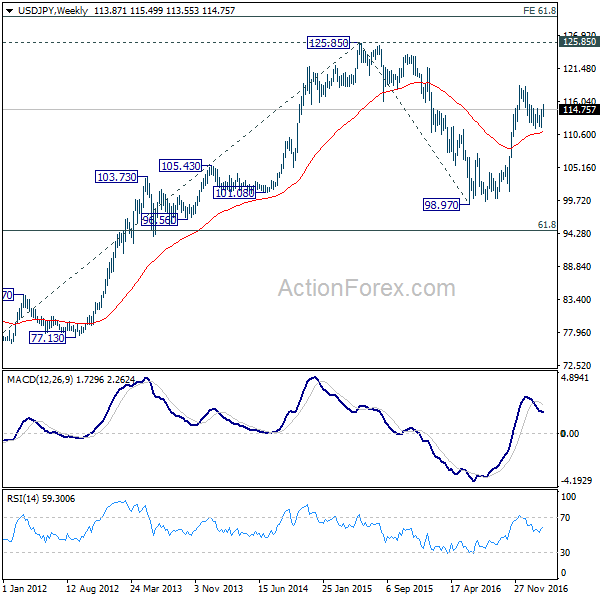
In the bigger picture, price actions from 125.85 high are seen as a corrective pattern. The impulsive structure of the rise from 98.97 suggests that the correction is completed and larger up trend is resuming. Decisive break of 125.85 will confirm and target 61.8% projection of 75.56 to 125.85 from 98.97 at 130.04 and then 135.20 long term resistance. Rejection from 125.85 and below will extend the consolidation with another falling leg before up trend resumption.
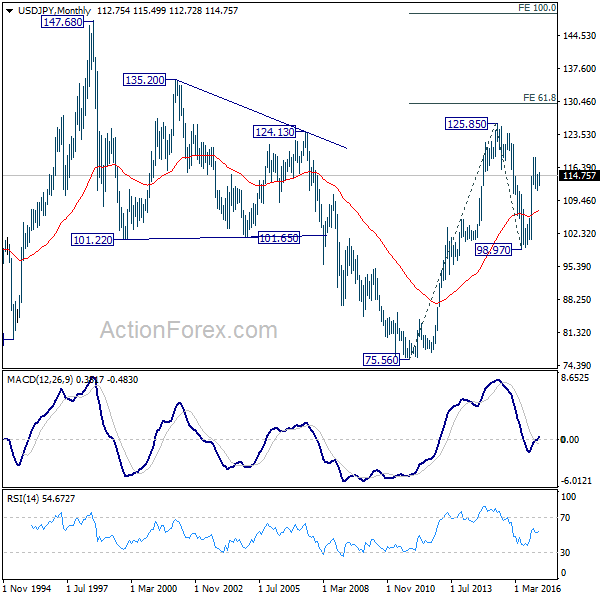
In the long term picture, the rise from 75.56 long term bottom to 125.85 medium term top is viewed as an impulsive move. Price actions from 125.85 are seen as a corrective move which could still extend. But, up trend from 75.56 is expected to resume at a later stage for above 135.20/147.68 resistance zone.


