
USD/JPY’s fall from 115.49 accelerated last week and the development invalidated our original bullish view. Instead, it suggests that price action from 111.58 are a consolidation pattern and is completed with three waves to 115.49. And the corrective decline from 118.65 is resuming.
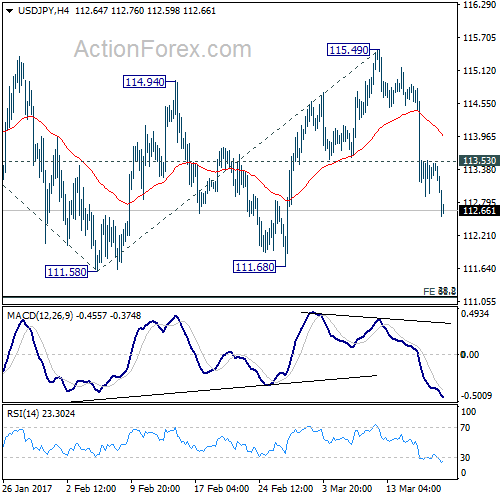
Initial bias remains on the downside this week for 111.58 and below. At this point, we’d tentatively expect strong support from 111.12/13 cluster support to contain downside. This level represents 61.8% projection of 118.65 to 111.58 from 115.49 at 111.12 and 38.2% retracement of 98.97 to 118.65 at 111.13. On the upside, above 113.53 minor resistance will turn bias to the up for 115.49 resistance. However, sustained break of 111.12/13 will bring deeper decline to 100% projection of 118.65 to 111.58 from 115.49 at 108.42.
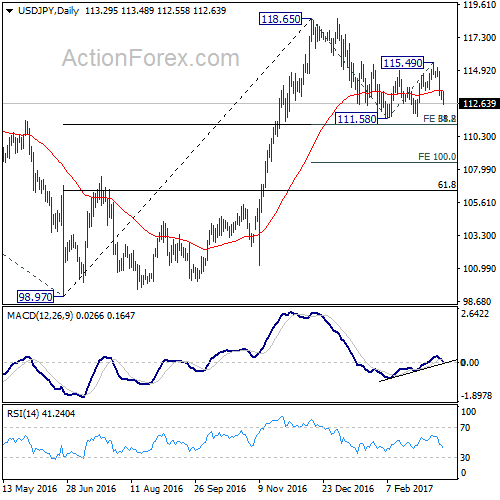
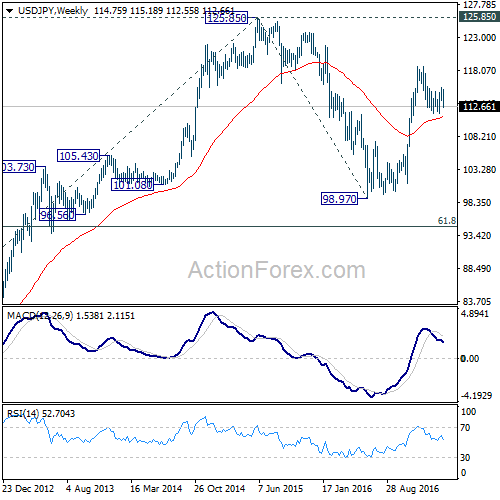
In the bigger picture, price actions from 125.85 high are seen as a corrective pattern. The impulsive structure of the rise from 98.97 suggests that the correction is completed and larger up trend is resuming. Decisive break of 125.85 will confirm and target 61.8% projection of 75.56 to 125.85 from 98.97 at 130.04 and then 135.20 long term resistance. Nonetheless, sustained trading below 55 week EMA (now at 111.08) will extend the consolidation from 125.85 with another fall through 98.97 before completion.
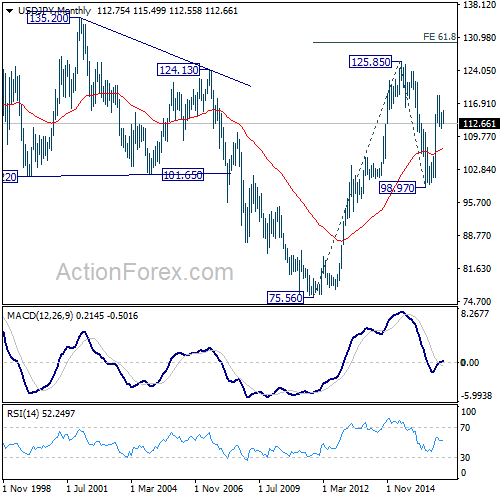
In the long term picture, the rise from 75.56 long term bottom to 125.85 medium term top is viewed as an impulsive move. Price actions from 125.85 are seen as a corrective move which could still extend. But, up trend from 75.56 is expected to resume at a later stage for above 135.20/147.68 resistance zone.


