
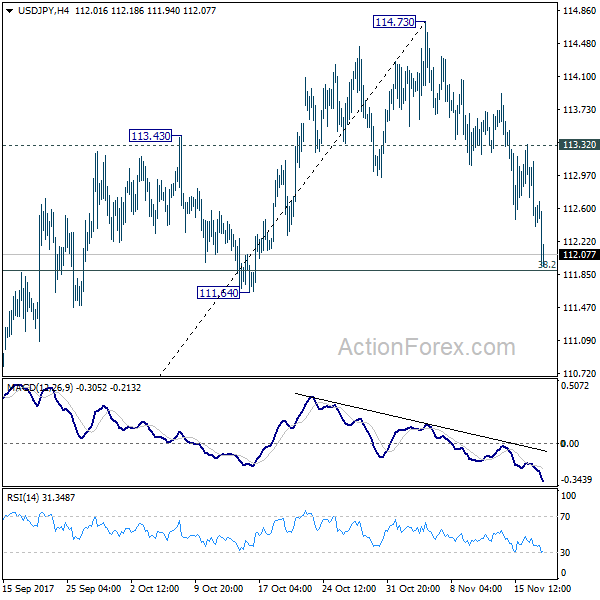
USD/JPY’s steep fall last week indicates rejection from 114.49 resistance. Initial bas stays on the downside this week with focus on 111.64 support. Decisive break there will argue that whole rebound from 107.31 has completed. In that case, deeper fall would be seen to 61.8% retracement of 107.31 to 114.73 at 101.14 and below. On the upside, though, break of 113.32 minor resistance will indicate that the pull back is completed and turn bias back to the upside.
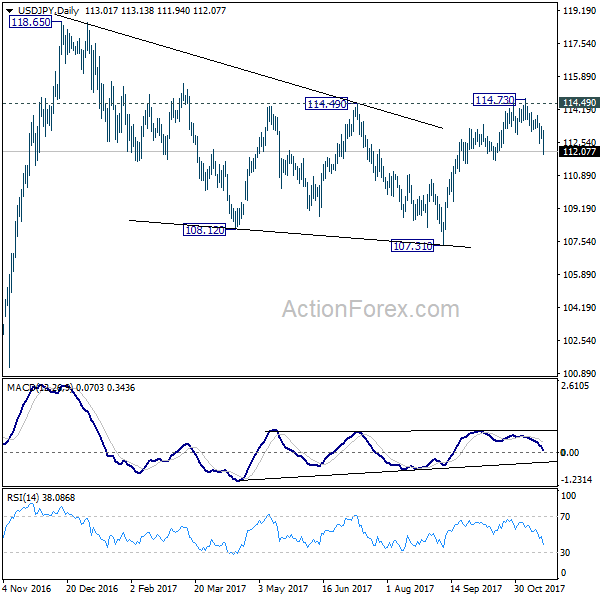
In the bigger picture, medium term rise from 98.97 (2016 low) is not completed yet. It should resume after corrective fall from 118.65 completes. Break of 114.49 resistance will likely resume the rise to 61.8% projection of 98.97 to 118.65 from 107.31 at 119.47 first. Firm break there will pave the way to 100% projection at 126.99. This will be the key level to decide whether long term up trend is resuming. However, firm break of 111.64 support will dampen this view and turn focus back to 107.31 instead.
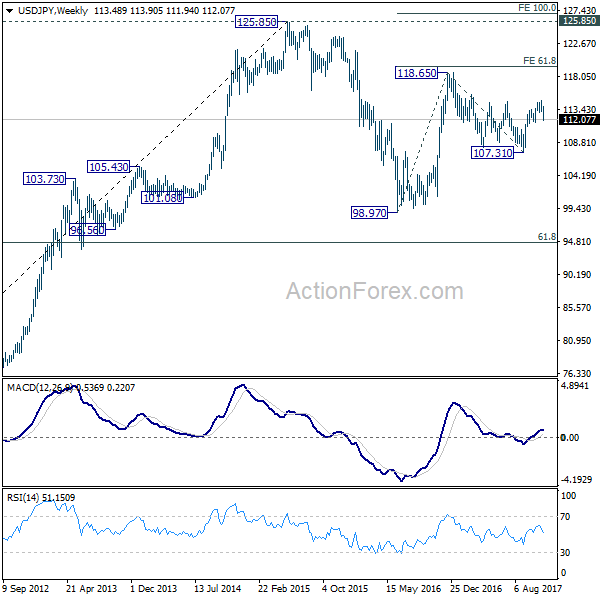
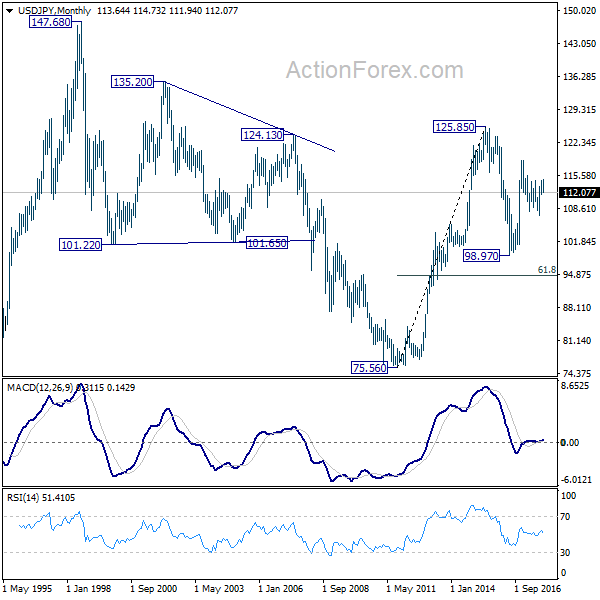
In the long term picture, the rise from 75.56 (2011 low) long term bottom to 125.85 top is viewed as an impulsive move, no change in this view. Price actions from 125.85 are seen as a corrective move which could still extend. In case of deeper fall, downside should be contained by 61.8% retracement of 75.56 to 125.85 at 94.77. Up trend from 75.56 is expected to resume at a later stage for above 135.20/147.68 resistance zone.


