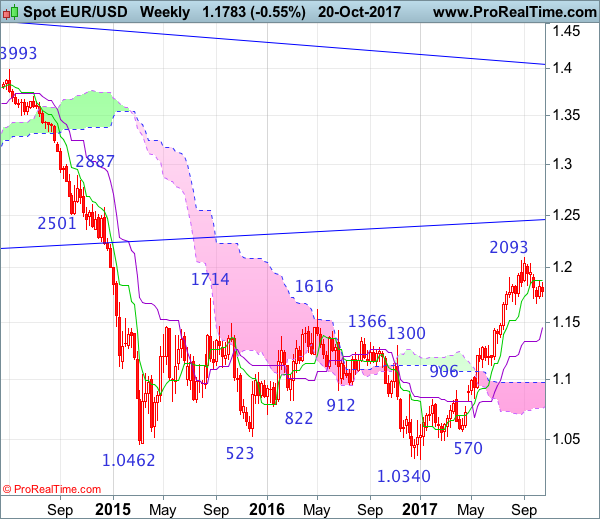
Weekly
• Last Candlesticks pattern: Shooting star
• Time of formation: 31 Jul 2017
• Trend bias: Near term up
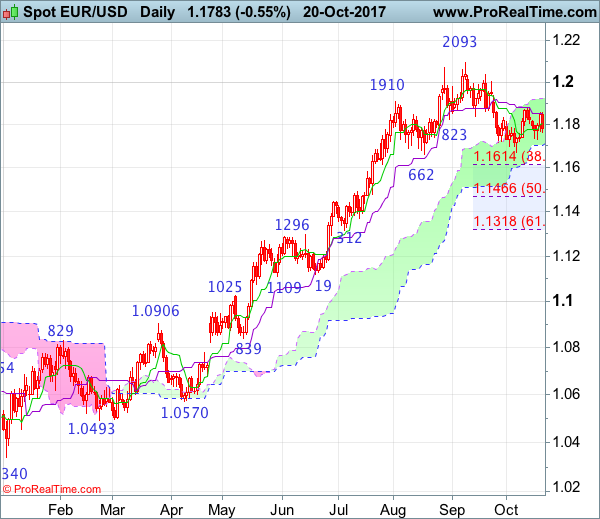
Daily
• Last Candlesticks pattern: Shooting star
• Time of formation: 2 Aug 2017
• Trend bias: Up
EUR/USD – 1.1770
Although the single currency retreated to as low as 1.1730 last week, as euro found support there and rebounded, retaining our bullishness for near term rise from 1.1669 low to resume after consolidation, above strong resistance at 1.1858 would add credence to this view and bring test of previous resistance at 1.1880. Once this level is penetrated, this would confirm and encourage for headway to the upper Kumo (now at 1.1922) but a daily close above there is needed to retain bullishness and extend gain to indicated resistance at 1.2005 but upside would be limited to resistance at 1.2035 and price should falter below key level at 1.2093.
On the downside, as long as support at 1.1730 holds, prospect of another rebound remains. A daily close below there would suggest the rebound from 1.1669 low has ended instead, risk another test of this level, break there would extend the erratic decline from 1.2093 top for retracement of early upmove to 1.1595-00, break there would bring subsequent fall to 1.1550, then towards 1.1500, having said that, previous support at 1.1479 should limit downside and 1.1466 (50% Fibonacci retracement of 1.0839-1.2093) should hold on first testing.
Recommendation: Hold long entered at 1.1775 for 1.1975 with stop below 1.1675.
On the weekly chart, the single currency remains confined within recent range and further sideways trading is in store, however, reckon downside would be limited to 1.1730 and bring another rebound later, above last week’s high at 1.1858 would bring test of 1.1880 would suggest the pullback from 1.2093 top has possibly ended and extend gain to 1.1935-40, then towards 1.2035-40. Having said that, break there is needed to provide confirmation, bring retest of 1.2093. A break above there would extend recent rise from 1.0340 low to 1.2160-70 (50% Fibonacci retracement of 1.3993-1.0340) but loss of upward momentum should limit upside to 1.2220-30 and reckon 1.2300-10 would hold from here, price should falter well below 1.2390-00, bring another retreat later
On the downside, below support at 1.1730 would risk another test of this month’s low at 1.1669 but only break there would signal a temporary top has been formed at 1.2093, bring retracement of recent rise to 1.1610-15 (38.2% Fibonacci retracement of 1.0839-1.2093) and possibly towards 1.1550, having said that, downside should be limited to 1.1510-20 and 1.1460-70 (50% Fibonacci retracement) should remain intact, price should stay well above support at 1.1312, bring another rise.