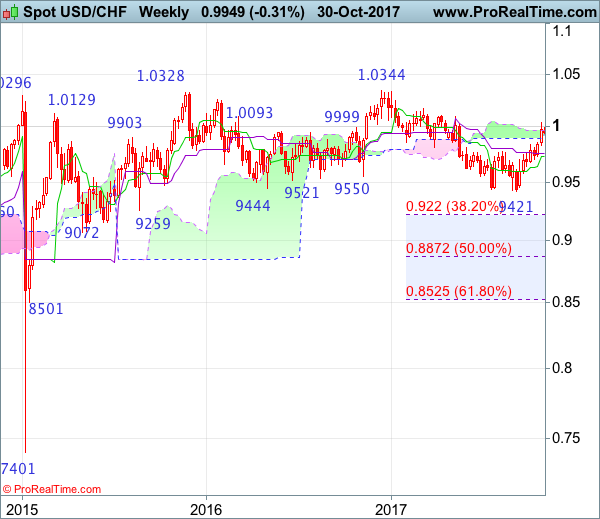
Weekly
• Last Candlesticks pattern: Shooting star
• Time of formation: 7 Mar 2017
• Trend bias: Sideways
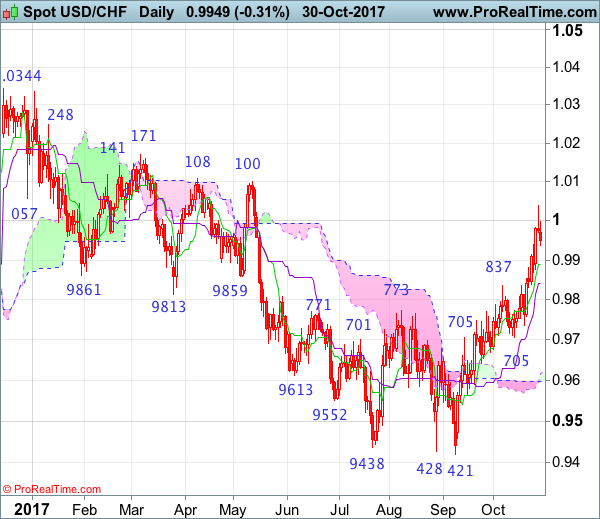
Daily
• Last Candlesticks pattern: Morning star
• Time of formation: 9 May 2017
• Trend bias: Near term up
USD/CHF – 0.9970
Although the greenback rose briefly to 1.0039 late last week, the subsequent quick retreat from there formed a shooting star candlestick reversal pattern, hence consolidation below this level would be seen with initial downside bias for pullback to the Tenkan-Sen (now at 0.9888), however, reckon the Kijun-Sen (now at 0.9841) would limit downside and bring another rise later, above said resistance at 1.0039 would extend the rise from 0.9421 low for retracement of early decline from 1.0344 to 1.0050, then towards resistance at 1.0100 which is likely to hold on first testing.
On the downside, a daily close below the Kijun-Sen (now at 0.9841) would bring weakness to 0.9770, however, only a daily close below support at 0.9737 would signal top has been formed instead, bring at least a retracement of recent rise to 0.9700, then test of minor support at 0.9670. A drop below this level would suggest the rise from 0.9421 has ended instead, risk further fall to 0.9642 support but reckon downside would be limited to 0.9590-00 and support at 0.9565 should remain intact.
Recommendation: Buy at 0.9830 for 1.0030 with stop below 0.9730.
On the weekly chart, last week’s rally to 1.0039 formed another white candlestick, adding credence to our near term bullish view that the rebound from 0.9421 low is still in progress and upside bias remains for this move to extend further gain towards resistance at 1.0100-08, however, near term overbought condition should prevent sharp move beyond previous resistance at 1.0171 and 1.0200-10 should hold from here, risk from there is seen for a retreat to take place later.
On the downside, although initial pullback to 0.9890-00 is likely, reckon 0.9800 would limit downside and bring another rise later. Below the Kijun-Sen (now at 0.9761) would bring test of 0.9730-37 (current level of the Tenkan-Sen and previous support) but break there is needed to signal top is formed and suggest first leg of rebound from 0.9737 has ended and bring weakness to 0.9690-00, however, reckon support at 0.9642 would limit downside and price should stay above support at 0.9565 and the greenback shall stage another strong rebound next month.