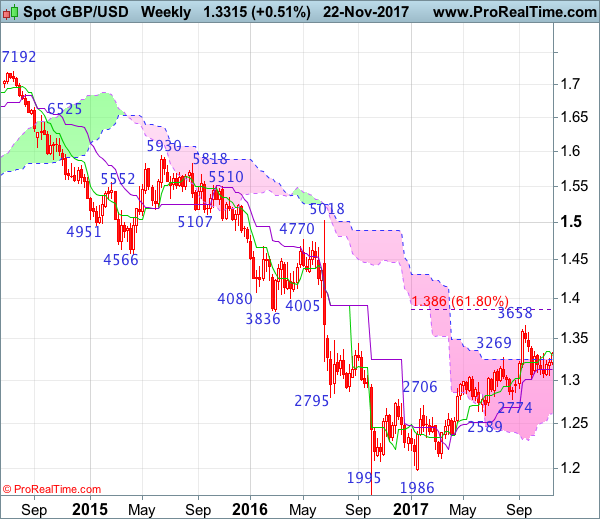
Weekly
• Last Candlesticks pattern: Shooting star
• Time of formation: 31 Jul 2017
• Trend bias: Down
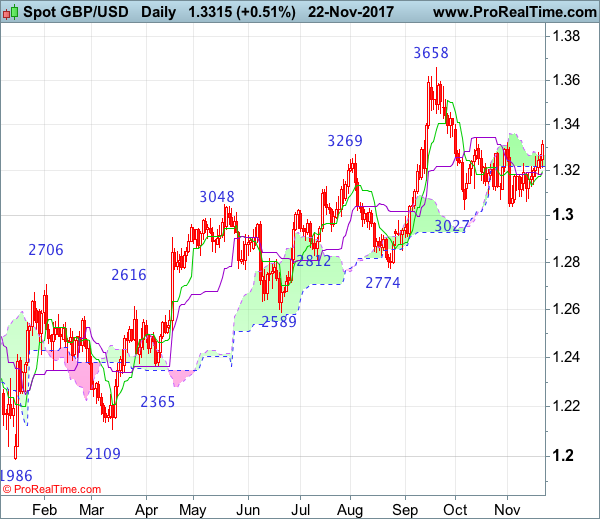
Daily
• Last Candlesticks pattern: Morning star
• Time of formation: 25 Aug 2017
• Trend bias: Near term up
GBP/USD – 1.3308
The British pound has surged again this week, suggesting the erratic rise from 1.3039 is still in progress and consolidation with mild upside bias remains, a daily close above 1.3338 resistance would confirm low has been formed at 1.3027 earlier, bring subsequent rise to 1.3400, then test of previous resistance at 1.3455, however, near term overbought condition should prevent sharp move beyond 1.3510-15 and reckon 1.3550 and price should falter below resistance at 1.3596, bring retreat later.
On the downside, whilst initial pullback to 1.3260-70 cannot be ruled out, reckon the Tenkan-Sen (now at 1.3200) would contain downside and bring another rise later. Below 1.3170 would prolong consolidation and bring weakness to 1.3100 but support at 1.3062 (last week’s low) would limit downside and indicated strong support area at 1.3027-39 should remain intact, bring rebound later. In the event sterling is able to penetrate 1.3027-39 support area, this would shift risk back to downside and confirm the fall from 1.3658 top has resumed for further weakness to 1.3000, then towards 1.2940-50 later but minor support at 1.2852 would contain downside.
Recommendation: Buy at 1.3200 for 1.3400 with stop below 1.3100.
On the weekly chart, sterling extended last week’s rebound and has continued moving higher this week, suggesting a test of previous resistance at 1.3338 would be seen, however, above there is needed to retain bullishness and suggest the retreat from 1.3658 has ended instead, bring a stronger rebound to 1.3400-05 and possibly towards 1.3490-00 but price should falter well below said resistance at 1.3658. In the event sterling breaks above 1.3571 resistance, this would bring a retest of this last month’s high at 1.3658, break there would extend recent erratic rise from 1.1986 low to 1.3750-60 and 1.3800 but overbought condition should prevent sharp move beyond 1.3860 (61.8% Fibonacci retracement of 1.5018-1.1986).
On the downside, expect pullback to be limited to 1.3260-60 and 1.3200 should hold, bring another rebound. Below last week’s low at 1.3062 would abort and risk test of indicated support area at 1.3027-39 but only break there would revive near term bearishness and signal a temporary top has been formed at 1.3658 earlier, bring retracement of recent rise to 1.3000, then towards support at 1.2909 but anticipated near term oversold condition should prevent sharp fall below previous chart support at 1.2774 and price should stay well above another previous chart support at 1.2589, bring rebound later.