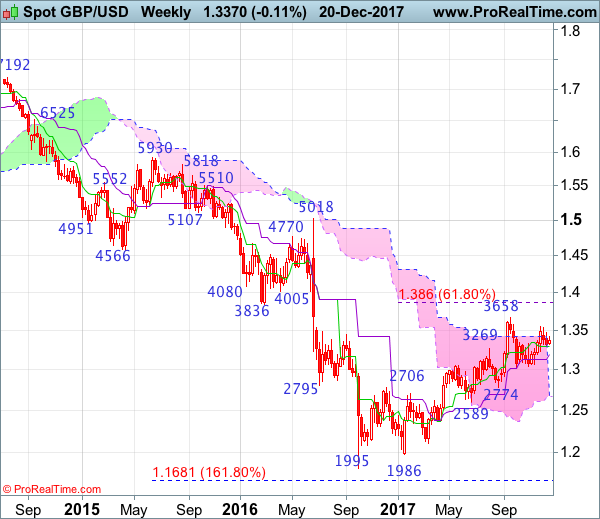
Weekly
• Last Candlesticks pattern: Shooting star
• Time of formation: 31 Jul 2017
• Trend bias: Down
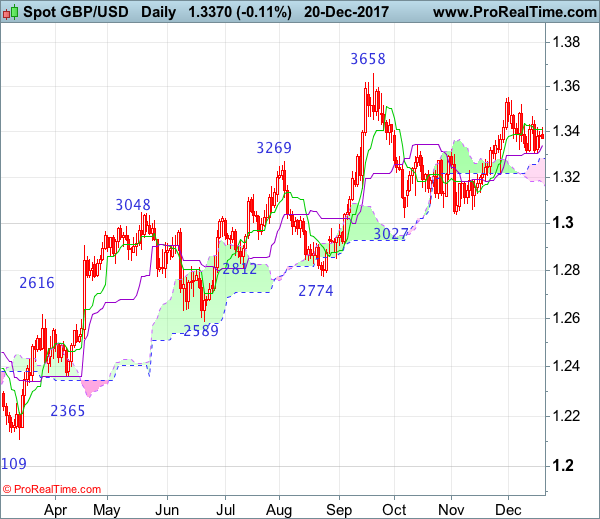
Daily
• Last Candlesticks pattern: Morning star
• Time of formation: 25 Aug 2017
• Trend bias: Near term up
GBP/USD – 1.3380
Although the British pound fell marginally to 1.3302 late last week, the subsequent rebound suggests further consolidation would b seen and test of 1.3420 cannot be ruled out, however, a daily close above resistance at 1.3466 is needed to signal the pullback from 1.3550 has ended and bring further gain to 1.3500, then retest of 1.3550. Only a break above this recent high would abort and signal the rise from 1.3027 has resumed instead, bring further subsequent headway to resistance at 1.3596, however, still reckon upside would be limited and price should falter below another previous chart resistance at 1.3658 (this year’s high).
On the downside, below 1.3330-35 would bring a retest of 1.3302, break there would extend the erratic decline from 1.3550 top for retracement o recent upmove to 1.3260-70, having said that,only a daily close below indicated support at 1.3221 retain bearishness, bring further fall to 1.3185-90 and later towards 1.3130 but sharp fall below there should not be repeated and price should stay above previous support at 1.3062.
Recommendation: Hold short entered at 1.3460 for 1.3260 with stop at break-even.
On the weekly chart, as sterling met resistance at 1.3466 last week and has retreated, retaining our bearishness and further consolidation below recent high at 1.3550 would be seen, hence mild downside bias remains for test of 1.3302 support, break there would add credence to our view that top has possibly been formed at 1.3550, bring further fall to support at 1.3221, once this level is penetrated, this would add credence to this view, bring further fall to 1.3130 and later towards strong support at 1.3062. Looking ahead, only a drop below 1.3027 support would revive bearishness and signal top has indeed been formed at 1.3658, bring a stronger correction of early rise to 1.3000, then towards support at 1.2909.
On the upside, expect recovery to be limited and said resistance at 1.3466 should hold, bring another retreat later. Above recent high at 1.3550 would shift risk back to the upside and extend the rise from 1.3027 to 1.3600, then test of last month’s high at 1.3658, break there would confirm medium term rise from 1.1986 low has resumed for headway to 1.3750-60 and 1.3800 but anticipated overbought condition should prevent sharp move beyond 1.3860 (61.8% Fibonacci retracement of 1.5018-1.1986).