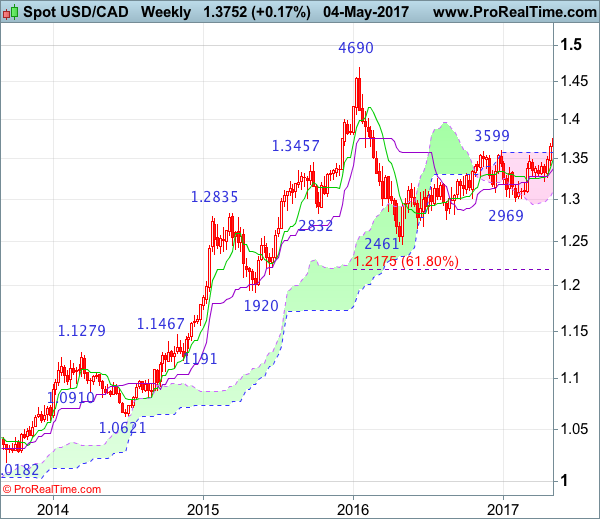
Weekly
• Last Candlesticks pattern: Bullish engulfing
• Time of formation: 02 May 2016
• Trend bias: Up
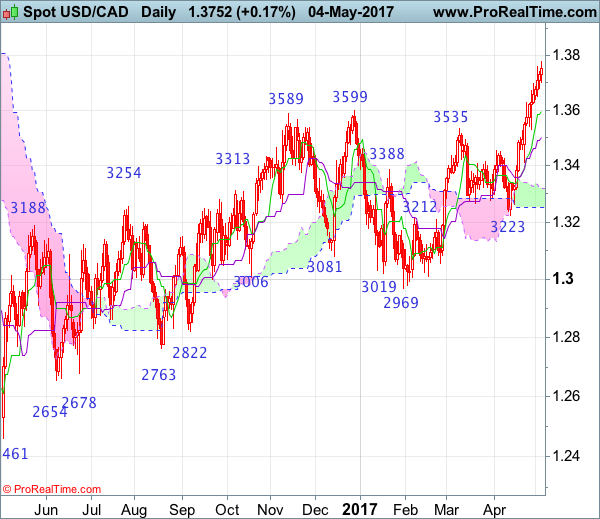
Daily
• Last Candlesticks pattern: Hammer
• Time of formation: 19 Oct 2016
• Trend bias: Up
USD/CAD – 1.3788
The greenback has surged again after breaking above indicated previous resistance at 1.3599, adding credence to our bullish view that early erratic upmove from 1.2461 low has resumed and upside bias remains for this move to extend further gain to 1.3835-40 (61.8% Fibonacci retracement of 1.4690-1.2461) and possibly towards 1.3900-10, however, near term overbought condition should prevent sharp move beyond 1.3950 and price should falter below psychological resistance at 1.4000, risk from there is seen for a retreat later.
On the downside, whilst initial pullback to 1.3700-10 cannot be ruled out, reckon the Tenkan-Sen (now at 1.3662) would limit downside and bring another rise later to aforesaid upside targets. Below support at 1.3530 would defer and suggest top is possibly but only a daily close below the Kijun-Sen (now at 1.3509) would add credence to this view, bring retracement of recent upmove to 1.3450-55 and then towards support at 1.3411 which is likely to hold from here and bring rebound.
Recommendation: Buy at 1.3650 for 1.3850 with stop below 1.3550.
On the weekly chart, as the greenback has rallied again after last week’s upmove above previous resistance at 1.3599, another white candlestick looks set to be formed this week, adding credence to our bullish view that the erratic upmove from 1.2461 (2016 low) is still in progress and bullishness remains for this move to extend headway to 1.3835-40 (61.8% Fibonacci retracement of 1.4690-1.2461) and then 1.3900 but overbought condition should prevent sharp move beyond psychological resistance at 1.4000, risk from there has increased for a retreat to take place.
On the downside, although initial pullback to 1.3700-10 cannot be ruled out, reckon downside would be limited to previous resistance at 1.3599 (now support) and bring another rise later. Only below the Tenkan-Sen (now at 1.3509) would defer and suggest top is possibly formed, risk weakness to 1.3450, then test of support at 1.3411 but reckon the Kijun-Sen (now at 1.3382) would limit downside and bring another rise later. In the event the pair drops below the Kijun-Sen, this would suggest top is formed instead, bring weakness to 1.3300, then 1.3260-65 but reckon support at 1.3223 would remain intact.