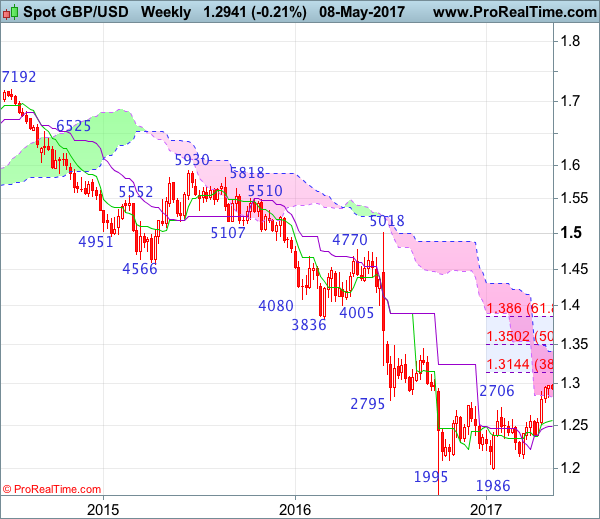
Weekly
• Last Candlesticks pattern: Long white candlestick
• Time of formation: 16 Jan 2017
• Trend bias: Down
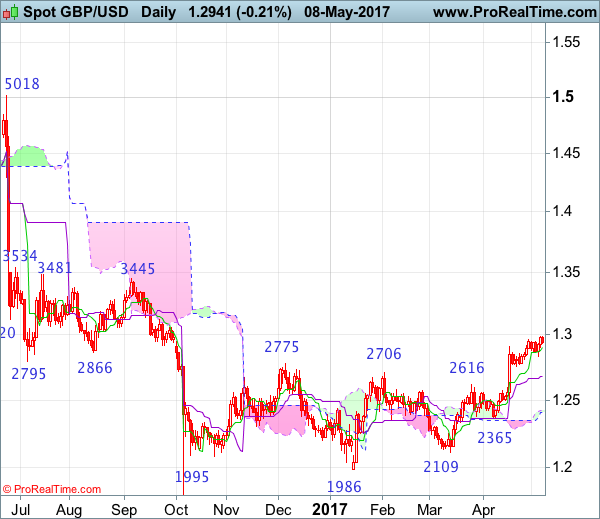
Daily
• Last Candlesticks pattern: Long white candlestick
• Time of formation: 18 Apr 2017
• Trend bias: Near term up
GBP/USD – 1.2928
As cable has maintained a firm undertone after resuming recent upmove, adding credence to our view that the rise from 1.1986 low (Jan low) is still in progress and bullishness remains for this move to bring retracement of early downtrend, hence further gain to 1.3000 psychological resistance, then 1.3050-60, however, loss of near term upward momentum should prevent sharp move beyond 1.3090-00 and reckon 1.3140-50 (38.2% Fibonacci retracement of 1.5018-1.1986) would hold on first testing, risk from there is seen for a retreat to take place later.
On the downside, whilst initial pullback to 1..2860-70 cannot be ruled out, reckon downside would be limited to 1.2800-10 would limit downside and bring another rise later. Only a daily close below support at 1.2757 would suggest top is possibly formed, bring weakness to 1.2700-10 but a daily close below the Kijun-Sen (now at 1.2678) would add credence to this view, bring correction to previous resistance at 1.2616, however, downside should be limited to 1.2575 and price should stay well above 1.2500, bring another rally later.
Recommendation: Buy at 1.2810 for 1.3010 with stop below 1.2710.
On the weekly chart, although cable’s firmness adds credence to our bullish view that the erratic rise from this year’s low at 1.1986 is still in progress and near term upside bias remains for this move to bring retracement of early decline, hence further gain to psychological resistance at 1.3000 and possibly towards 1.3090-00 would be seen, however, reckon upside would be limited to 1.3140-50 (38.2% Fibonacci retracement of 1.5018-1.1986) and price should falter well below 1.3200-10, bring retreat later.
On the downside, although initial pullback to 1.2860-70 cannot be ruled out, reckon downside would be limited to 1.2800-10 and bring another rise. Below previous resistance at 1.2706 would defer and suggest top is possibly formed, risk weakness to 1.2640-50, however, only a drop below another previous resistance at 1.2616 would add credence to this view, bring further fall to 1.2550-60 but reckon support at 1.2515 would hold, bring another rise later. Only a drop below 1.2500 would abort and signal top is formed instead, then test of the Kijun-Sen (now at 1.2489) would follow but support at 1.2365 should remain intact.