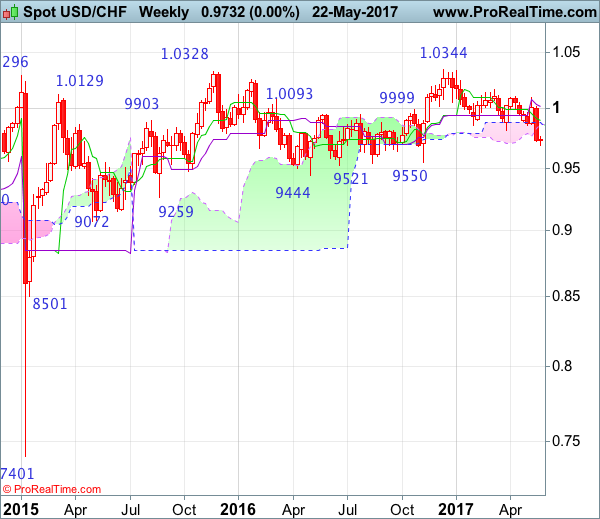
Weekly
• Last Candlesticks pattern: Shooting star
• Time of formation: 7 Mar 2017
• Trend bias: Sideways
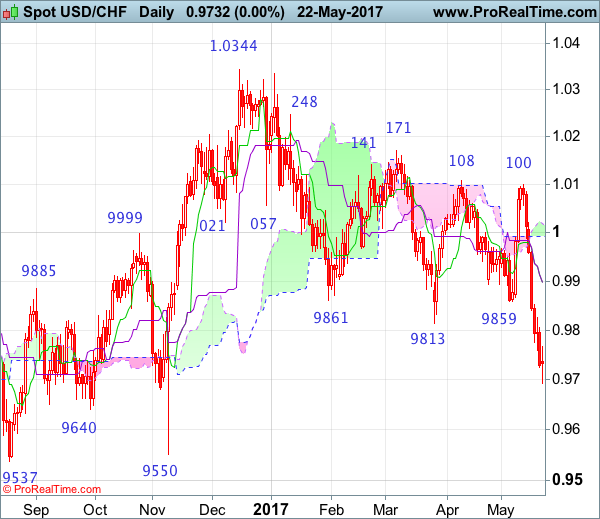
Daily
• Last Candlesticks pattern: Morning star
• Time of formation: 9 May 2017
• Trend bias: Near term up
USD/CHF – 0.9944
The greenback met heavy selling interest at 1.0100 earlier this month and has tumbled from there, the subsequent breach of previous support at 0.9813 confirms early decline from 1.0344 top (2016 high) has resumed and bearishness is seen for this move to extend further weakness to 0.9650, then towards 0.9600, however, near term oversold condition should prevent sharp fall below latter level and price should stay above 0.9550 support, bring rebound later.
On the upside, whilst initial recovery to 0.9800 is likely, reckon upside would be limited to 0.9850 and renewed selling interest should emerge around 0.9880-85, bring another decline later. A daily close above the Kijun-Sen (now at 0.9896) would defer and suggest a temporary low is formed instead, bring a stronger rebound to 0.9960 but reckon upside would be limited to the Ichimoku cloud (now at 0.9992-1.0018) and price should falter well below said resistance at 1.0100, bring another selloff.
Recommendation: Sell at 0.9885 for 0.9685 with stop above 0.9985
On the weekly chart, last week’s selloff formed a long black candlestick and the breach of previous support at 0.9813 confirms early erratic fall from 1.0344 top is still in progress, hence bearishness is seen for this move to bring retracement of early upmove to 0.9640-50, then 0.9600 but reckon downside would be limited to previous support at 0.9550 and price should stay above 0.9500, risk from there has increased for a strong rebound later.
On the upside, although initial recovery to 0.9825 and then 0.9850-55 would be seen, reckon upside would be limited to the Tenkan-Sen (now at 0.9900) and bring another decline later. Only above the Kijun-Sen (now at 1.0018) would abort and suggest a temporary low is formed instead, bring test of previous resistance at 1.0100 but a weekly close above there is needed to retain bullishness and signal the aforesaid decline from 1.0344 has ended, bring test of 1.0171 resistance next.