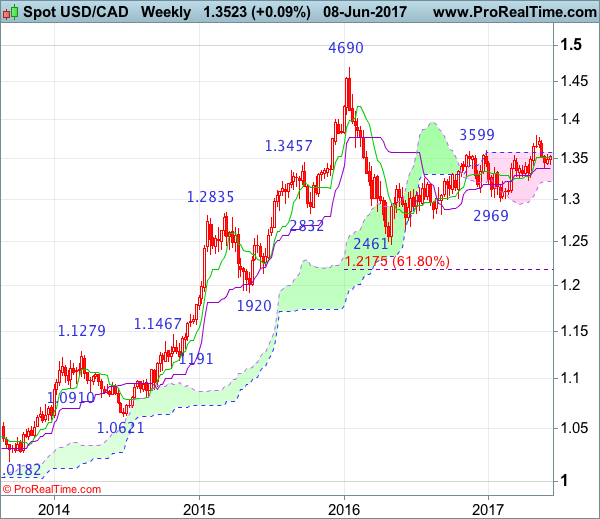
Weekly
• Last Candlesticks pattern: Shooting doji
• Time of formation: 02 May 2016
• Trend bias: Up
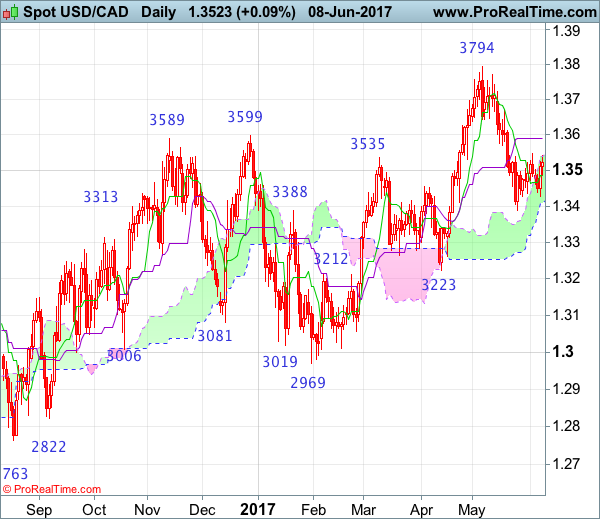
Daily
• Last Candlesticks pattern: Bearish engulfing
• Time of formation: 5 May 2017
• Trend bias: Up
USD/CAD – 1.3512
Although the greenback has rebounded again after finding support at 1.3426 and further consolidation above support at 1.3387 would be seen, reckon upside would be limited to 1.3545-50 and price should falter below the Kijun-Sen (now at 1.3591), bring another decline later, below 1.3426 would bring retest of said support at 1.3387 but break there is needed to signal the fall from 13794 top has resumed and extend weakness to 1.3300-10, however, break of support at 1.3262 is needed to retain bearishness and bring test of key level at 1.3223. Looking ahead, only a daily close below this support would signal recent entire rise from 1.2461 has ended instead, bring further fall to 1.3150-60 and possibly towards 1.3100 but support at 1.3056 should remain intact and price should stay above 1.3009.
On the upside, whilst initial recovery to 1.3530-40 cannot be ruled out, reckon the Kijun-Sen (now at 1.3591) would cap upside and bring another decline. Only a daily close above the Kijun-Sen would defer and suggest first leg of decline from 1.3794 has ended instead, bring a stronger rebound to 1.3630 and then 1.3670 but upside should be limited to 1.3700-10 and price should falter below said resistance at 1.3794, bring another decline later.
Recommendation: Hold short entered at 1.3540 for 1.3340 with stop above 1.3640.
On the weekly chart, as the greenback recovered after finding support right at the Kijun-Sen, suggesting further consolidation above support at 1.3387 would be seen, however, reckon upside would be limited to 1.3545-50 and the upper Kumo (now at 1.3576) should hold, bring another decline later, below said support at 1.3387 would signal the fall from 1.3794 top is still in progress for retracement of recent rise to 1.3345-50, then towards 13262 support but break of key level at 1.3223 is needed to add credence to this view, bring further fall to 1.3140-50, then 1.3080-85, however, downside should be limited to 1.3000-10 and previous chart support at 1.2969 should remain intact.
On the upside, expect recovery to be limited to 1.3547 resistance (last week’s high) and bring another decline. Above the upper Kumo (now at 1.3576) would bring a stronger rebound towards resistance at 1.3670 but still reckon upside would be limited to 1.3700 and bring another decline later. Only a break of 1.3794 resistance would revive bullishness and signal recent erratic upmove from 1.2461 (2016 low) has resumed and extend further gain to 1.3835-40 (61.8% Fibonacci retracement of 1.4690-1.2461) and then 1.3900 but psychological resistance at 1.4000 should remain intact.