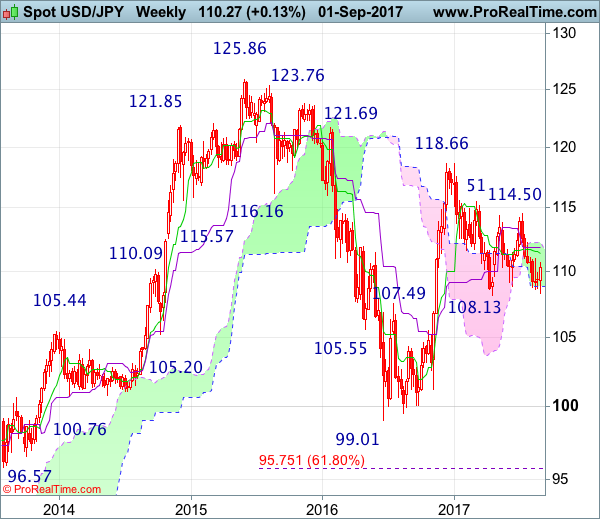
Weekly
• Last Candlesticks pattern: Dark cloud cover
• Time of formation: 10 Jul 2017
• Trend bias: Down
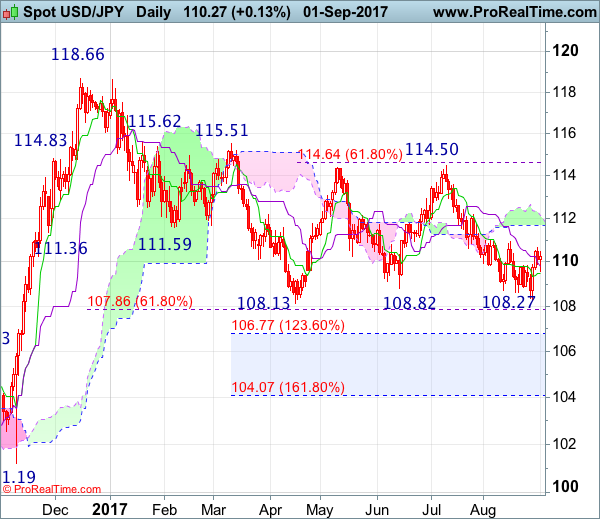
Daily
• Last Candlesticks pattern: Evening doji
• Time of formation: 7 Aug 2017
• Trend bias: Down
USD/JPY – 109.53
Although the greenback extended recent fall from 114.50 to as low as 108.27, as the pair then staged a strong rebound after holding above previous support at 108.13, suggesting medium term downtrend is not ready to resume yet and further consolidation above said 2016 low would take place and another bounce towards resistance at 110.95 cannot be ruled out, however, break there is needed to signal the aforesaid fall from 114.50 has ended at 108.27, bring retracement of this fall to the lower uno (now at 111.66) but reckon the upper Kumo (now at 112.15) would limit upside and resistance at 112.20 should remain intact.
On the downside, expect pullback to be limited to 109.15-20 (61.8% Fibonacci retracement of 108.27-110.67) and bring another rebound. A daily close below 108.95-00 would suggest the rebound from 108.27 has possibly ended, bring weakness to 108.50-55 but said support at 108.27 should hold from here. In the event dollar is able to penetrate said support at 108.13, this would confirm early decline from 118.66 top has resumed and extend weakness to 107.50, then towards 106.50-55 (61.8% Fibonacci retracement of 99.01-118.66).
Recommendation : Hold short entered at 110.55 for 108.55 with stop above 110.50.
On the weekly chart, despite last week’s fall to 108.27, the subsequent rebound after holding above this year’s low at 108.13 formed a white candlestick (first one in 8 weeks), suggesting the fall from 114.50 has formed a temporary low there, hence consolidation above this level is seen for another bounce to resistance at 110.95, then test of the Tenkan-Sen (now at 111.39) and possibly to the Kijun-Sen (now at 111.82), however, reckon resistance at 112.20 would limit upside and price should falter below 112.90-00, bring another decline later.
On the downside, whilst pullback to 109.90 cannot be ruled out, reckon support at 108.50-55 would hold and bring another rebound later. A sustained breach below last week’s low at 108.27 would revive bearishness but dollar needs to penetrate support at 108.13 to confirm early fall from 118.66 top has resumed for weakness to 117.40-50, then 117.00, however, downside should be limited to 106.50-55 (61.8% Fibonacci retracement of 99.01-118.66) and previous resistance at 105.53 would turn into support, price should stay above 105.00, bring rebound later.