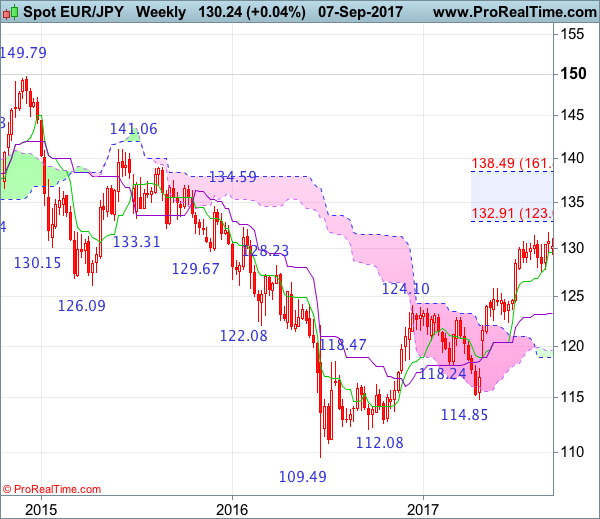
Weekly
• Last Candlesticks pattern: Window
• Time of formation: 24 April 2017
• Trend bias: Up
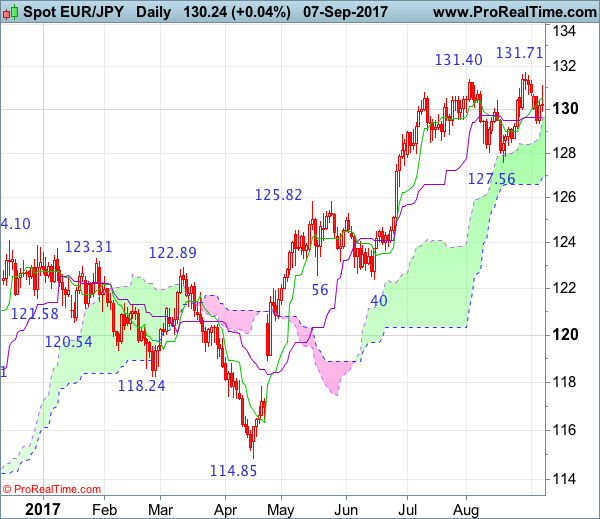
Daily
• Last Candlesticks pattern: Hammer
• Time of formation: 18 May 2017
• Trend bias: Up
EUR/JPY – 130.00
Euro’s retreat after last week’s brief rise to 131.71 (a doji star was formed on the daily chart, followed by two black candlesticks) suggests a temporary top has been formed there and as the single currency has slipped again after meeting renewed selling interest at 131.09 yesterday, retaining our view that further consolidation below said resistance at 131.71 would be seen and another fall to support at 129.37 is likely. A drop below this level would add credence to our view that top has been made, bring retracement of recent rise to 129.00-10, then towards 128.45-50, however, break of latter level is needed to retain bearishness and encourage for subsequent weakness towards support at 127.56 which is likely to hold from here.
On the upside, whilst recovery to 130.50-60 cannot be ruled out, said resistance at 131.09 should hold, bring another decline later. A daily close above this level would suggest the retreat from 131.71 has ended, bring retest of this level but break there is needed to extend recent upmove to 132.50-60, however, euro’s upside is likely to be limited to 133.10-15 (61.8% projection of 122.40-131.40 measuring from 127.56) and reckon 133.50-60 would hold from here, price should falter well below 134.00-10, risk from there has increased for a retreat to take place later.
Recommendation: Sell at 130.60 for 128.60 with stop above 131.60.
On the weekly chart, despite last week’s rise to 131.71, the subsequent retreat formed a doji star alike pattern and if this week ends with a black candlestick, this would suggest a potential bearish reversal pattern is formed, hence consolidation below 131.71 would be seen with mild downside bias for test of 129.37 support, break there would bring further fall to 129.00, then 128.00 but only break of previous support at 127.56 would confirm a temporary top is formed, bring retracement of recent upmove to 126.70-80, then towards 126.00-10 but previous resistance at 125.81 should turn into support and limit euro’s downside.
On the upside, expect recovery to be limited to 130.50-60 and resistance at 131.09 (this week’s high) should hold, bring another retreat later. A weekly close above 131.09 would signal the pullback from 131.71 has ended, bring retest of this level, break there would signal the erratic upmove from 109.49 (2016 low) is still in progress and may extend headway to previous chart resistance at 132.33, however, overbought condition should limit upside to 133.10-15 (61.8% projection of 122.40-131.40 measuring from 127.56) and price should falter well below 134.40 (61.8% Fibonacci retracement of entire fall from 149.79-109.49), risk from there is seen for a retreat to take place later.