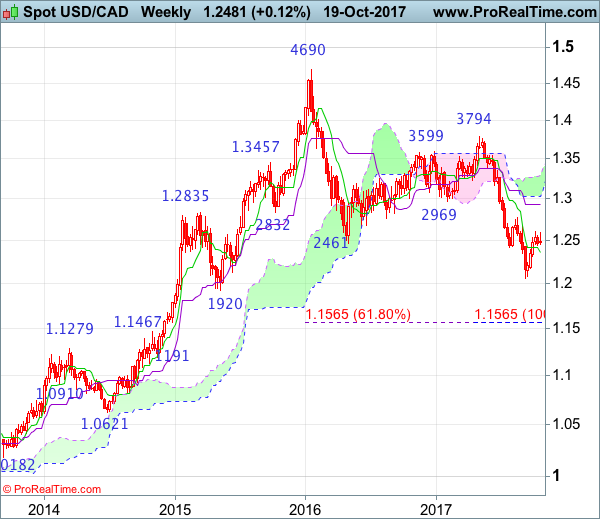
Weekly
• Last Candlesticks pattern: Shooting doji
• Time of formation: 01 May 2017
• Trend bias: Sideways
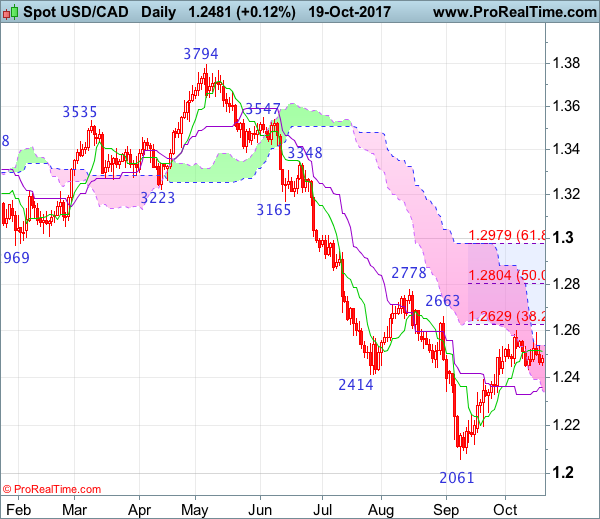
Daily
• Last Candlesticks pattern: Bearish engulfing
• Time of formation: 5 May 2017
• Trend bias: Down
USD/CAD – 1.2470
Although the greenback rebounded earlier this week to as high as 1.2591, as the pair has retreated after faltering below recent high at 1.2599, retaining our view that further consolidation below this level would be seen and test of 1.2433 support cannot be ruled out, below there would bring retracement of recent rise towards the Kijun-Sen (now at 1.2360) but reckon 1.2310-15 would contain downside and bring another rise later. Only a break of said resistance at 1.2599 would confirm the rise from 1.2061 low has resumed and bring retracement of early decline to 1.2620-25, then towards resistance at 1.2663, having said that, reckon upside would be limited to 1.2700-10 and price should falter below resistance at 1.2778.
On the downside, whilst initial pullback to 1.2433 and then 1.2390-00 cannot be ruled out, reckon the Kijun-Sen (now at 1.2360) would limit downside and 1.2315-25 would hold, bring another rise later. Only a daily close below support at 1.2254 would abort and signal the rebound from 1.2061 has ended instead, bring weakness to 1.2198, break there would add credence to this view and extend weakness to 1.2121. Having said that, break there is needed to retain bearishness and bring further fall towards said recent low at 1.2061. Looking ahead, below 1.2061would extend downtrend to psychological level at 1.2000, having said that, loss of momentum should prevent sharp fall below 1.1920-25 (61.8% projection) and 1.1900 should hold.
Recommendation: Buy at 1.2325 for 1.2525 with stop below 1.2225
On the weekly chart, as the greenback has retreated after failing to penetrate resistance at 1.2599, suggesting further consolidation below this level would be seen and pullback to 1.2433, then 1.2390-00 cannot be ruled out, however, if our view that a temporary low formed at 1.2061 is correct, downside should be limited to 1.2315-25 and bring another rebound later. Above 1.2599 would extend the corrective rise from 1.2061 low for retracement of recent decline to previous resistance at 1.2663, then 1.2700-10, having said that, price should falter below previous resistance at 1.2778, bring another decline later in Q4.
On the downside, expect pullback to be limited to 1.2390-00 and 1.2300-10 should hold, bring another rise later to aforesaid retracement targets. Below 1.2121 support would abort and signal the rebound from last month’s low at 1.2061 has ended, bring retest o this level later. A drop below 1.2061 would confirm decline from 1.3794 top has resumed and extend weakness towards psychological support at 1.2000, however, reckon downside would be limited to 1.1920-25 (61.8% projection of 1.3794-1.2414 measuring from 1.2778) and reckon 1.1840-50 would hold from here, price should stay above 1.1750-60, bring rebound later.