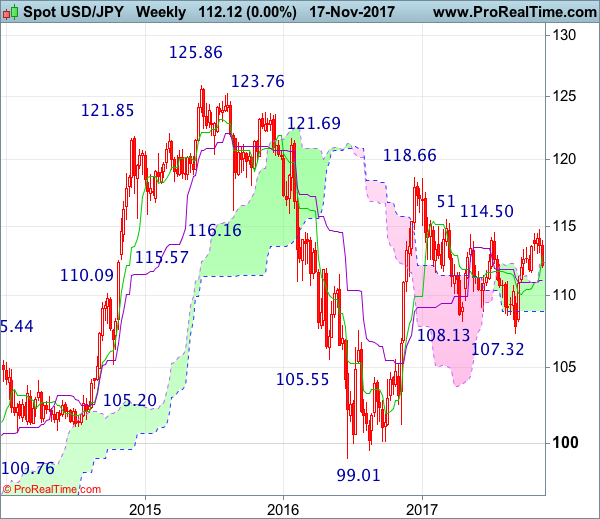
Weekly
• Last Candlesticks pattern: Dark cloud cover
• Time of formation: 10 Jul 2017
• Trend bias: Down
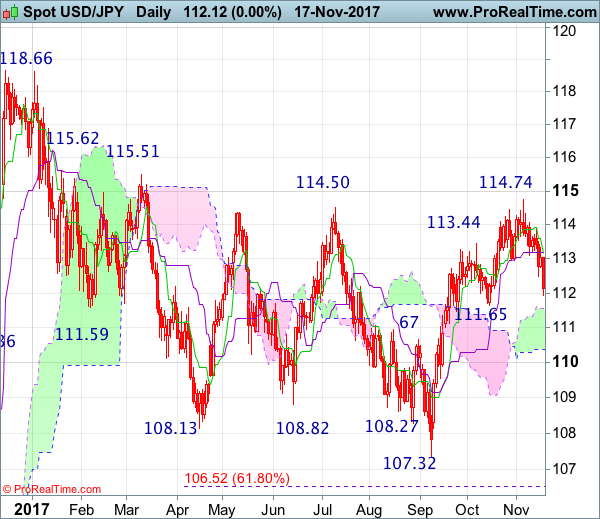
Daily
• Last Candlesticks pattern: Evening doji
• Time of formation: 7 Aug 2017
• Trend bias: Down
USD/JPY – 112.09
Although the greenback rebounded initially to 113.91, dollar had met heavy selling pressure there and dropped quite sharply since, dampening our bullishness and suggesting a temporary top has been formed at 114.74, hence consolidation with mild downside bias is seen for test of previous support at 111.65, however, break there is needed to retain bearishness and extend the fall from 114.74 top for retracement of recent upmove to 111.00, having said that, reckon the lower Kumo (now at 110.38) would contain downside, price should stay above 110.00, bring rebound later due to near term oversold condition.
On the upside, whilst recovery to 112.50-60 cannot be ruled out, reckon the Tenkan-Sen (now at 112.98) would limit upside and bring another decline later. Above 113.45-50 would bring another test of said resistance at 113.91 but only a daily close above this last week’s high) would suggest low is formed instead, bring a stronger rebound to 114.10-20 and later retest of said recent high at 114.74. Looking ahead, only a break above this level would revive bullishness and signal early fall from 118.66 has ended and extend the rise from 107.32 to 115.00, then towards previous resistance at 115.51-62.
Recommendation : Sell at 112.90 for 110.90 with stop above 113.90
On the weekly chart, despite early brief breach of previous resistance at 114.50, lack of follow through buying and the subsequent stronger-than-expected retreat formed another long black candlestick, suggesting a temporary top has been formed at 114.74, hence consolidation with mild downside bias is seen for weakness to previous support at 111.65, break there would extend fall to the Kijun-Sen (now at 111.03), however, near term oversold condition should limit downside to 110.40-50 and reckon 110.00 would hold from here.
On the upside, expect recovery to be limited to 112.50-60 and reckon the Tenkan-Sen (now at 113.11) would hold and bring another decline later. A weekly close above the Tenkan-Sen would bring test of said last week’s high at 113.91 but only break there would revive bullishness and signal the retreat from 114.74 has ended, bring retest of this level. Once this resistance is penetrated, this would extend recent rise from 107.32 to 115.51-62 resistance area, break there would add credence to our view that early erratic decline from 118.66 has ended at 107.32, then headway to 116.50-60 and possibly 117.00-10 would follow.