Weekly
• Last Candlesticks pattern: Bullish engulfing
• Time of formation: 02 May 2016
• Trend bias: Up
Daily
• Last Candlesticks pattern: Hammer
• Time of formation: 19 Oct 2016
• Trend bias: Up
USD/CAD – 1.3350
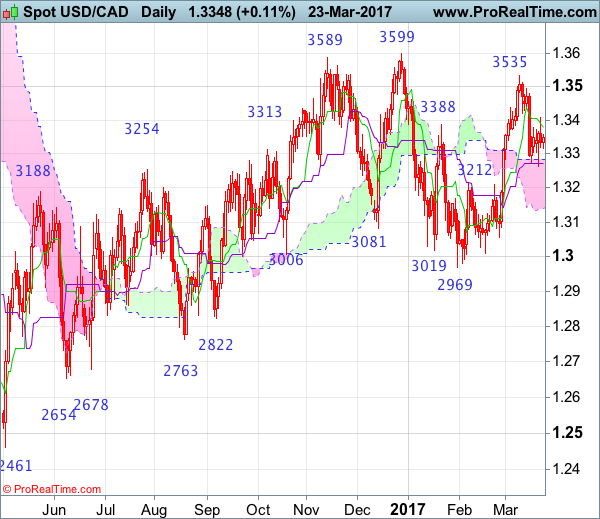
Although the greenback found support at 1.3264 and recovered, as renewed selling interest emerged at 1.2409 and price has retreated, suggesting near term downside risk remains for the retreat from 1.3535 top to bring retracement of recent upmove and below said support at 1.3264 would bring weakness to 1.3230, however, reckon downside would be limited to 1.3200 and bring another rise later. A daily close above 1.2409 resistance would suggest the pullback from 1.3535 top has ended and bring further gain to 1.2490-00 but said resistance at 1.3535 would hold on first testing. Looking ahead, only a break of this level would retain bullishness and extend early erratic upmove from 1.2461 low to 1.3599, then 1.3660-70 but still reckon upside would be limited to 1.3700 and risk from there is seen for a retreat later.
On the downside, whilst initial fall to 1.3250 cannot be ruled out, reckon 1.3200 would limit downside and bring another rebound later. Only below previous resistance at 1.3210 would abort and signal top has indeed been formed at 1.3535, bring further fall to 1.3160-65 and possibly towards 1.3100 but price should stay well above support at 1.3056, bring rebound later. Only a daily close below this level would revive bearishness and signal the rebound from 1.2969 has indeed ended, bring further fall to 1.3000 first, however, said support at 1.2969 should remain intact.
Recommendation: Buy at 1.3200 for 1.3400 with stop below 1.3100.
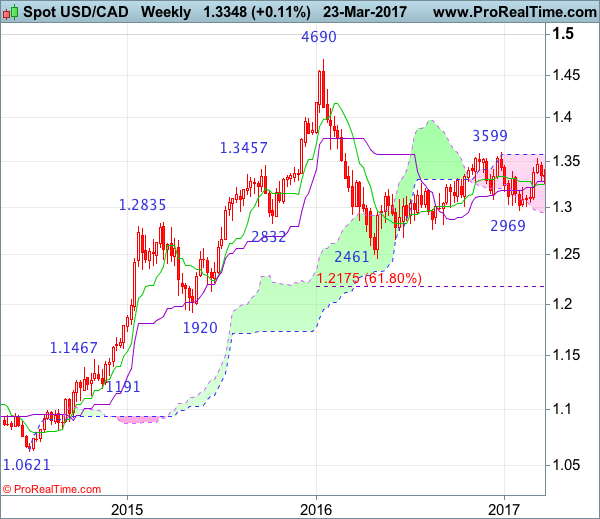
On the weekly chart, as the greenback retreated after meeting resistance at 1.3535, suggesting consolidation below this level would be seen and pullback to 1.3250-60 cannot be ruled out, however, reckon downside would be limited to 1.3200-10 and bring another rise later. Above 1.3405-10 would bring test of 1.3495 resistance but break of latter level is needed to signal the pullback from 1.3535 has ended, bring retest of this level first, break there would extend recent rise from 1.2969 to indicated resistance at 1.3599, however, a break of this resistance is needed to retain bullishness and signal upmove from 1.2461 (2016 low) has resumed for headway to 1.3700 and later towards 1.3835-40 (61.8% Fibonacci retracement of 1.4690-1.2461) which is likely to cap upside.
On the downside, although pullback to the Tenkan-Sen (now at 1.3252) cannot be ruled out, reckon downside would be limited to 1.3210 and bring another rise later. A drop below previous resistance at 1.3210 would suggest a temporary top is formed instead, risk weakness to 1.3150-60, break there would add credence to this view and signal the rebound from 1.2969 has ended, bring further fall to towards 1.3083, however, indicated support at 1.3056 support should hold.