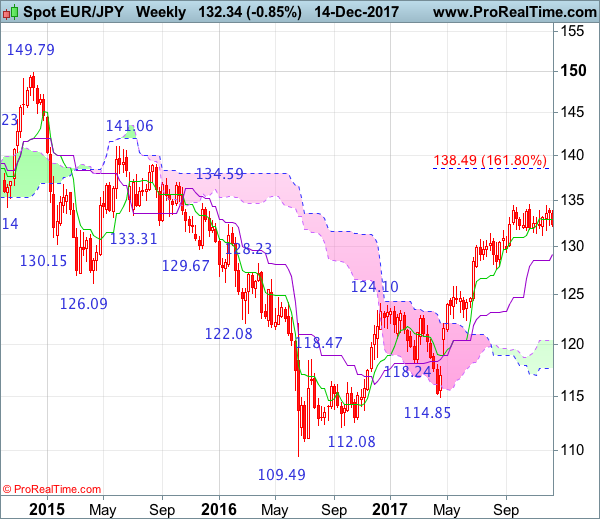
Weekly
• Last Candlesticks pattern: Window
• Time of formation: 24 April 2017
• Trend bias: Up
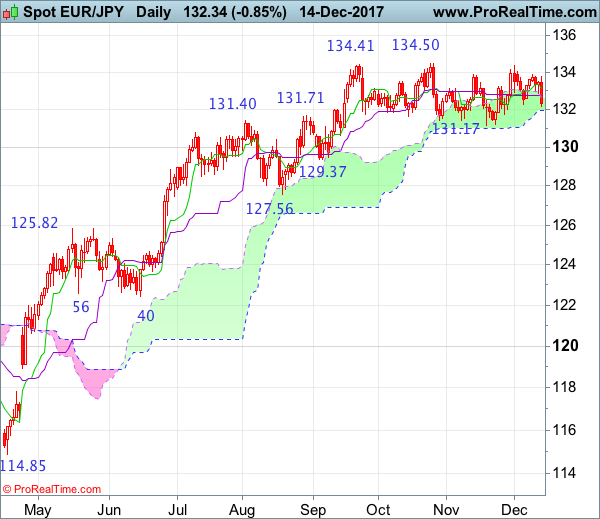
Daily
• Last Candlesticks pattern: Hammer
• Time of formation: 18 May 2017
• Trend bias: Up
EUR/JPY – 132.22
Despite rebounding to 133.89 earlier this week, euro met renewed selling interest there and has dropped quite sharply yesterday, dampening our bullishness and downside risk remains for weakness to 131.99 support, break there would signal top has been formed at 134.38 earlier this month, bring test of support 131.72. Looking ahead, a drop below 131.72 would signal the rebound from 131.17 has ended, bring weakness to 131.40, then retest of this level but still reckon downside would be limited to 130.40-50 and psychological level at 130.00 should hold from here.
On the upside, whilst recovery to the Kijun-Sen (now at 132.78) cannot be ruled out, reckon the Tenkan-Sen (now at 133.03) would limit upside and yesterday’s high at 133.76 should remain intact, bring another decline. Only break of this week’s high at 133.89 would revive bullishness, bring test of 134.38 first. Having said that, a break of indicated resistance at 134.50 is needed to confirm recent upmove has resumed and extend gain to 135.00.
Recommendation: Stand aside for this week
On the weekly chart, as the single currency faltered below last week’s high at 134.05 and has slipped this week, a black candlestick looks set to be formed, suggesting further consolidation below resistance at 134.38 would be seen and test of previous support at 131.72 is likely, however, only break of indicated strong support at 131.17 would shift risk to downside and suggest a temporary top has been formed earlier at 134.50, bring retracement of recent rise to support at 130.90-00, then 130.20-25 but reckon downside would be limited to 129.37 support and previous support at 127.56 should remain intact.
On the upside, expect recovery to be limited to 133.00-05 and bring another decline. above 133.89 would bring another test of 134.38 but only break of indicated recent high at 134.50 would confirm recent upmove from 109.49 (2016 low) has resumed and extend gain to 135.00, then 136.00-10 but reckon upside would be limited and 136.95-00 should hold, price should fatter below 138.45-50 (1.618 times extension of 109.49-124.10 measuring from 114.85), bring retreat later.