Weekly
• Last Candlesticks pattern: Shooting star
• Time of formation: 03 May 2016
• Trend bias: Down
Daily
• Last Candlesticks pattern: Shooting star
• Time of formation: 3 May 2016
• Trend bias: Sideways
EUR/USD – 1.0868
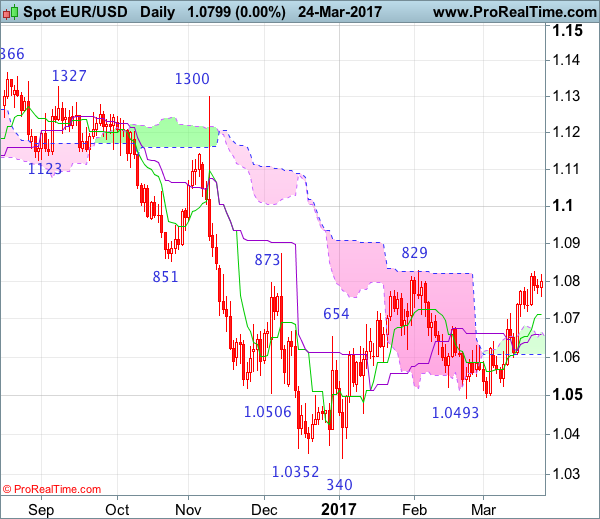
The single currency only eased to 1.0719 (we recommended to buy at 1.0690 last week and missed our long entry) before finding renewed buying interest and euro has rallied again since, price broke above indicated previous resistance at 1.0829, adding credence to our view that early erratic rise from 1.0340 low is still in progress and may extend further subsequent gain to 1.0930-35 (61.8% Fibonacci retracement of 1.1300-1.0340), then towards 1.1000, however, near term overbought condition should prevent sharp move beyond 1.1050 and reckon 1.1100 would hold from here, risk from there is seen for a retreat later.
On the downside, whilst initial pullback to 1.0830-35 cannot be ruled out, reckon 1.0780-85 would limit downside and bring another upmove later to aforesaid upside targets. A daily close below support at 1.0760 would risk test of the Tenkan-Sen (now at 1.0741) but support at 1.0719 should remain intact, bring another rise later. A drop below the Kijun-Sen (now at 1.0684) would defer and suggest top is possibly formed, bring test of the upper Kumo (now at 1.0654) but a drop below the lower Kumo (now at 1.0607) is needed to signal top is formed, bring further fall to 1.0550 later.
Recommendation: Buy again at 1.0785 for 1.0985 with stop below 1.0685.
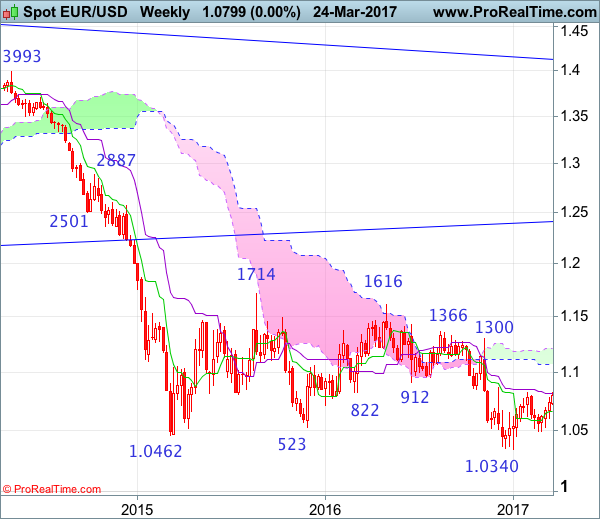
On the weekly chart, the single currency finally broke above previous resistance at 1.0829, adding credence to our near term bullish view for the erratic rise from 1.0340 low is still in progress for retracement of recent decline, hence upside bias remains for further gain to 1.0930-35 (61.8% Fibonacci retracement of 1.1300-1.0340) and possibly 1.1000, however, reckon upside would be limited to 1.1050-60 and price should falter below 1.1100-10, risk from there is seen for a retreat to take place later.
On the downside, although initial pullback to 1.0825-30 is likely, reckon downside would be limited to 1.0785-90 and bring another rise later. Below last week’s low at 1.0719 would defer and risk test of the Tenkan-Sen (now at 1.0684) but break of indicated support at 1.0600 is needed to signal top is formed, bring further subsequent decline to 1.0525 support but support at 1.0493 should remain intact. A drop below 1.0493 would suggest the corrective rise from 1.0340 has ended instead, bring further fall to key support at 1.0454, only a sustained breach below this level would provide confirmation, then further fall to 1.0390-00 and later retest of this January low would follow.