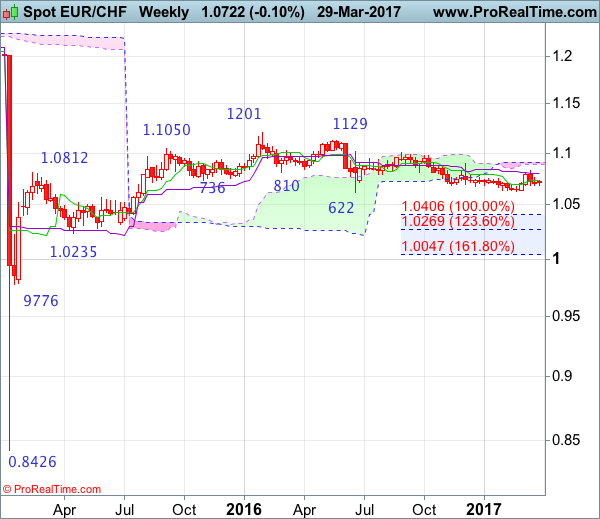
Weekly
• Last Candlesticks pattern: Doji
• Time of formation: 20 Feb 2017
• Trend bias: Up
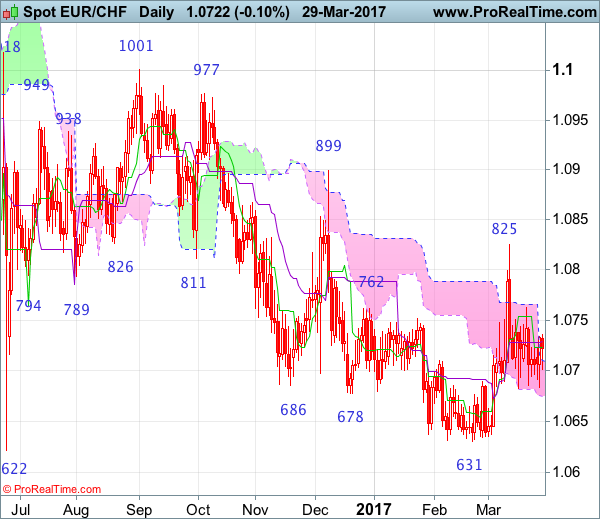
Daily
• Last Candlesticks pattern: Doji
• Time of formation: 1 Sep 2016
• Trend bias: Near term down
EUR/CHF – 1.0723
As the single currency continued finding support around 1.0683-84 and has recovered, retaining our view that further sideways consolidation would be seen and mild downside bias remains for another retreat to said support, however, break of 1.0622-31 level is needed to retain bearishness and signal the decline from 1.1201 (2016 high) has resumed and extend further fall to 1.0590-00, then towards 1.0530-35 but loss of downward momentum should prevent sharp fall below 1.0500, price should stay well above 1.0400-10, risk from there has increased for a strong rebound to take place later.
On the upside, whilst recovery towards resistance at 1.0763 cannot be ruled out, reckon upside would be limited and bring another decline later. A daily close above 1.0763 would risk another bounce to indicated resistance at 1.0825 but break there is needed to shift risk back to upside and signal low has been formed instead, bring further subsequent gain to 1.0850, however, price should falter below key resistance at 1.0899 (Dec high), risk from there is seen for a retreat later.
Recommendation: Hold short entered at 1.0725 for 1.0525 with stop above 1.0825.
On the weekly chart, as the single currency retreated after meeting resistance at 1.0825 earlier this month and a long black candlestick was formed, suggesting top is possibly formed there and consolidation below this level is seen with mild downside bias for weakness towards strong support at 1.0622-31, however, break there is needed to signal recent decline from 1.1201 top has resumed and extend further fall to 1.0550-55, then 1.0500-10 but oversold condition should prevent sharp fall below 1.0400-10 (100% projection of 1.1201-1.0622 measuring from 1.1001) and price should stay well above previous support at 1.0314, risk from there is seen for a rebound to take place later.
On the upside, expect recovery to be limited and resistance at 1.0763-70 should hold, bring another decline. Only above said resistance at 1.0825 would signal low has been formed at 1.0631, bring retracement of recent decline to 1.0850 but a break above indicated resistance at 1.0899 is needed to add credence to this view and bring a stronger rebound to 1.0970-75, then test of 1.1001. Looking ahead, only a sustained breach above 1.1001 would signal the fall from 1.1201 has ended, bring further gain to 1.1100 but reckon resistance at 1.1129 would hold on first testing.