GBP/USD – 1.2977
GBP/USD – Wave 4 is unfolding as an (A)-(B)-(C) and could have ended at 1.7192
Although the British pound has risen again and rose to as high as 1.3048, loss of upward momentum should prevent sharp move beyond 1.3100 and risk is seen for a retreat to take place, below 1.2885-90 would bring pullback to 1.2844 support, however, downside should be limited to 1.2800 and previous support at 1.2757 (previous 4th of a lesser degree) should attract renewed buying interest and bring another rally towards 1.3140-50 (38.2% Fibonacci retracement of 1.5018-1.1986) but risk from there has increased for a retreat later.
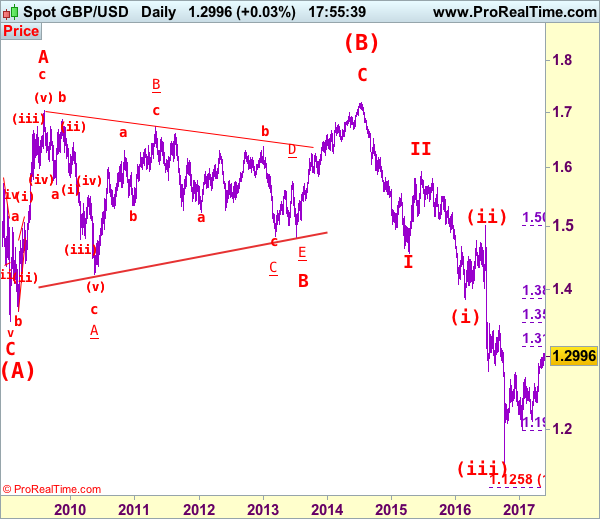
Our preferred count on the daily chart is that cable’s rebound from 1.3500 (wave (A) trough) is unfolding as a wave (B) with A ended at 1.7043, followed by triangle wave B and wave C as well as wave (B) has possibly ended at 1.7192, below support at 1.4232 would add credence to this count, then further fall to 1.4000 level would follow but reckon downside would be limited to 1.3655 support and price should stay above previous support at 1.3500.
On the downside, whilst initial pullback to 1.2885-90 cannot be ruled out, reckon downside would be limited to 1.2844 and 1.2757 support should attract renewed buying interest, bring another upmove. Below previous resistance at 1.2706 (now support) would signal a temporary top is formed, bring retracement of recent upmove to 1.2650-60 but previous resistance at 1.2616 (tentatively wave i top) should remain intact.
Recommendation: Buy at 1.2760 for 1.3000 with stop below 1.2660.
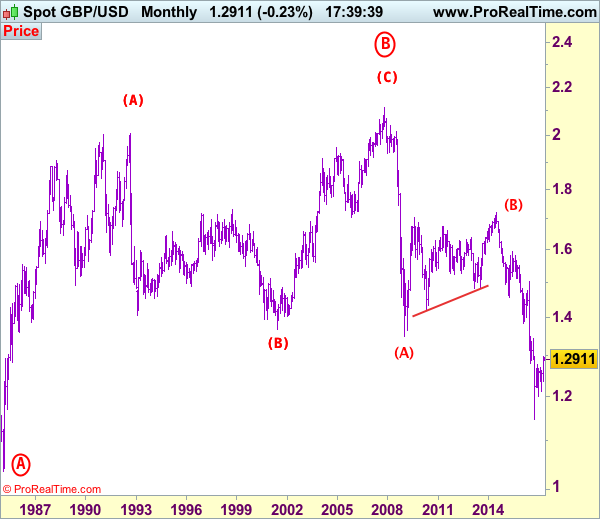
Longer term – Cable’s rise from 1.0520 (Feb 1985) to 2.0100 (September 1992) is seen as [A], the decline to 1.3682 is labeled as (B) and (C) wave rally has ended at 2.1162 (9 Nov, 2007) which is also the top of larger degree wave B with circle. The selloff from there is a 5-waver with wave (A) ended at 1.3500 (23 Jan 2009), wave (B) itself is labeled as A: 1.6733, triangle wave B: 1.4813 and wave C as well as top of wave (B) ended at 1.7192 (2014), hence the selloff from there is an impulsive wave (C) with wave I : 1.4566, wave II 1.5930, an extended wave III is unfolding and already exceeded our downside target at 1.3500 and 1.3000, hence weakness to 1.2500 and possibly 1.2000 cannot be ruled out, however, price should stay well above psychological level at 1.0000.