EUR/JPY – 124.71
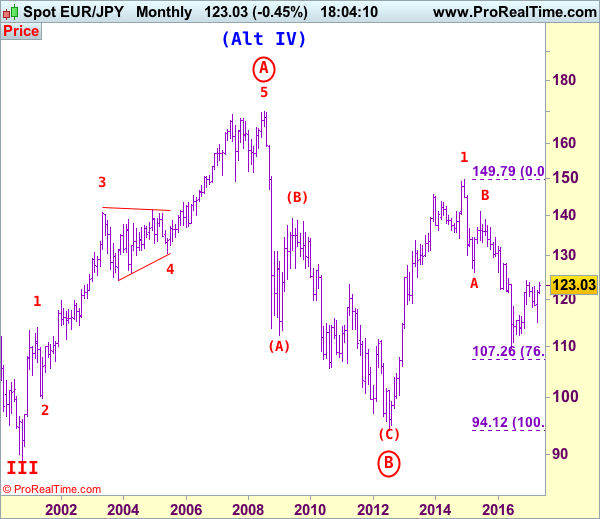
EUR/JPY: Wave v as well as larger degree wave (C) ended at 94.11 and first leg of larger degree wave C upmove has possibly ended at 149.79 and wave 2 correction has possibly ended at 109.49.
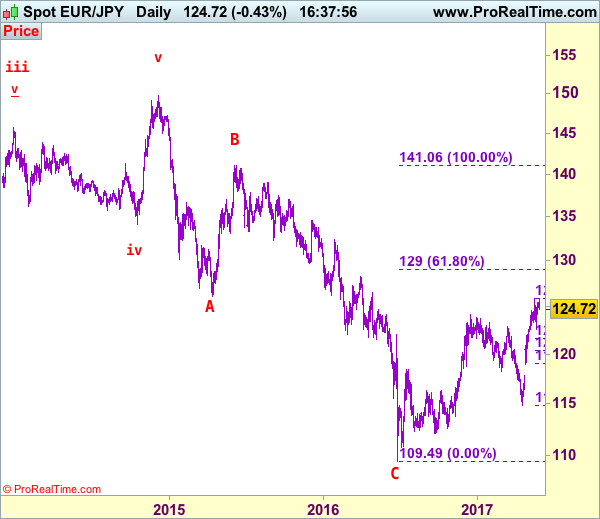
As the single currency has surged again after finding renewed buying interest at 122.56 last week, suggesting recent upmove from 109.49 low is still in progress and bullishness remains for this move to extend further gain to resistance at 126.47 and possibly 127.50-60, however, reckon upside would be limited to 128.17 resistance and price should falter well below 129.00 (61.8% Fibonacci retracement of 141.06-109.49), risk from there has increased for another retreat to take place later.
The daily chart is labeled as attached, early selloff from 169.97 (July 2008) to 112.08 is wave (A) of B instead of end of entire wave B and then the rebound from there to 139.26 is wave (B), hence, wave (C) has possibly ended at 94.12 with a diagonal triangle as labeled in the daily chart, hence upside bias is seen for further gain. Recent rally above indicated retracement level at 116.69 (50% Fibonacci retracement of the intermediate fall from 139.26-94.12) adds credence to this view and signal major reversal has commenced but first leg of this wave C has possibly ended at 149.79, hence wave 2 has commenced with wave A ended at 126.09, followed by wave B at 141.06, wave C commenced and could have ended at 109.49, above 125.00 would add credence to this view.
On the downside, whilst initial pullback to 124.40-50 and possibly 124.00 cannot be ruled out, reckon downside would be limited to 123.00-10 and 121.60-65 (38.2% Fibonacci retracement of 114.85-125.82) should hold, bring another rise later. A daily close below 121.60-65 would defer and suggest top is formed instead, risk correction to 121.00 and possibly towards support at 120.60 but reckon 120.30-35 (50% Fibonacci retracement) would limit downside and psychological level at 120.00 should hold.
Recommendation: Buy at 121.60 for 124.50 with stop below 120.60.
To re-cap the corrective upmove from the record low of 88.93 (18 Oct 2000), the wave A from there is subdivided as: 1:88.93-113.72, 2:99.88 (1 Jun 2001), 3:140.91 (30 May 2003), 4:124.17 (10 Nov 2003) and 5 ended at record high of 169.97 (21 Jul 2008). The brief but sharp selloff to 112.08 is viewed as a-b-c x a-b-c wave (A) of B. The subsequent rebound to 139.26 is (B) of B and (C) of (B) has possibly ended at 94.12 and in any case price should stay well above previous chart support at 88.93, bring rally in larger degree wave C towards 150.00.