GBP/CHF – 1.2485
GBP/CHF – Circle wave v ended at 0.9106 and major correction has commenced for subsequent gain to 1.5547.
As sterling has rebounded again after holding above support at 1.2241, retaining our view that further consolidation above this level would be seen and recovery to 1.2540-50 (previous resistance and 38.2% Fibonacci retracement of 1.3069-1.2241) is likely, however, reckon upside would be limited to 1.2655-60 (50% Fibonacci retracement) and bring another decline later (probably in early Q3). Below 1.2390-95 would weakness to 1.2310-15 but break of said support at 1.2241 is needed to signal the fall from 1.3069 top has resumed for test of previous chart support at 1.2215, then 1.2150, having said that, loss of momentum should prevent sharp fall below another chart support at 1.2102 (this year’s low).
To recap the larger degree count, the selloff from 2.4965 (July 2007) is the beginning of wave V with circle and is labeled as 1: 2.3760, 2: 2.4425, wave 3 extension ended at 1.1470, followed by wave 4 at 1.5547, the quick rebound from 0.9106 suggests wave 5 as well as entire circle wave V could have ended there, hence consolidation with mild upside bias is seen for major correction to take place, bring initial test of 1.5547 (previous 4th of a lesser degree).
On the upside, whilst initial recovery to 1.2540-50 cannot be ruled out, reckon upside would be limited to 1.2655-60 (50% Fibonacci retracement of 1.3069-1.2241) and bring another decline later. Only a daily close above resistance at 1.2690-95 would abort and suggest first leg of decline from 1.3069 has ended, bring a stronger rebound to 1.2740-50, however, as top has been formed at 1.3069, still reckon upside would be limited to 1.2785-90 and price should falter below 1.2850-60, bring another decline later.
Recommendation: Sell at 1.2655 for 1.2355 with stop below 1.2755.

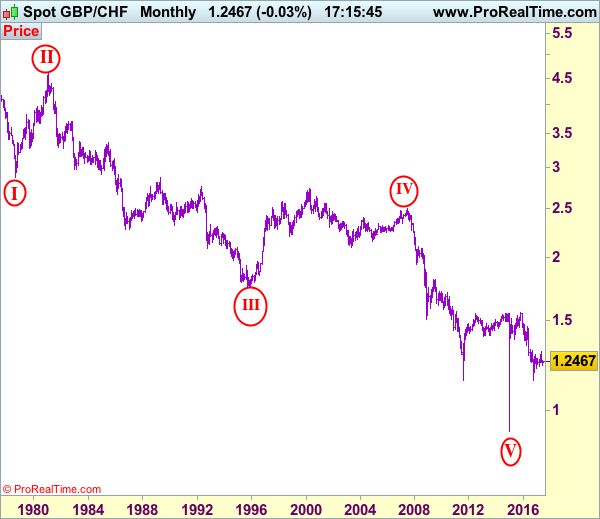
On the Monthly chart, the longer-term count is that major downtrend is under way with circle wave I at 2.8645 (Sep 1.978), then wave II with circle at 4.6175 (Feb 1981), the wave III with circle ended at 1.7425 (Nov 1995) and followed by wave IV with circle at 2.4965 (July 2007 with a short wave C) and wave V with circle has possibly ended at 0.9106. A monthly close above 1.5547 would add credence to this view, bring major correction to 1.7000, then towards psychological level at 2.0000.