
GBP/USD – 1.3019
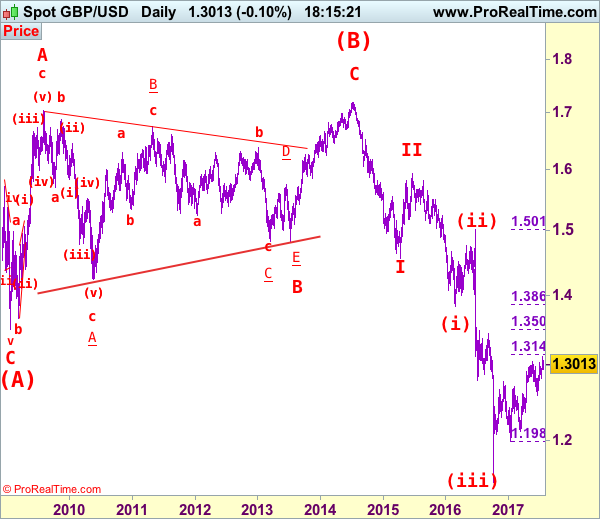
GBP/USD – Wave 4 is unfolding as an (A)-(B)-(C) and could have ended at 1.7192
Cable’s retreat after last week’s initial brie rise to 1.3126 suggests a temporary top is possibly formed and consolidation below this level would be seen with downside bias for weakness and below 1.2933 support would bring weakness to 1.2890-00, however, break of indicated previous support at 1.2812 is needed to provide confirmation to this view, bring retracement of recent upmove to 1.2770, then towards 1.2700-10 which is likely to hold from here.
Our preferred count on the daily chart is that cable’s rebound from 1.3500 (wave (A) trough) is unfolding as a wave (B) with A ended at 1.7043, followed by triangle wave B and wave C as well as wave (B) has possibly ended at 1.7192, below support at 1.4232 would add credence to this count, then further fall to 1.4000 level would follow but reckon downside would be limited to 1.3655 support and price should stay above previous support at 1.3500.
On the upside, whilst initial recovery to 1.3060 cannot be ruled out, as top has been formed at 1.3126, reckon upside would be limited and bring another decline later. Only break of said resistance at 1.3126 would suggest the erratic rise from 1.1986 low is still in progress for further gain to 1.3140-50 (38.2% Fibonacci retracement of 1.5018-1.1986) and possibly 1.3200 but overbought condition should prevent sharp move beyond 1.3300.
Recommendation: Hold short entered at 1.3040 for 1.2840 with stop below 1.3140.
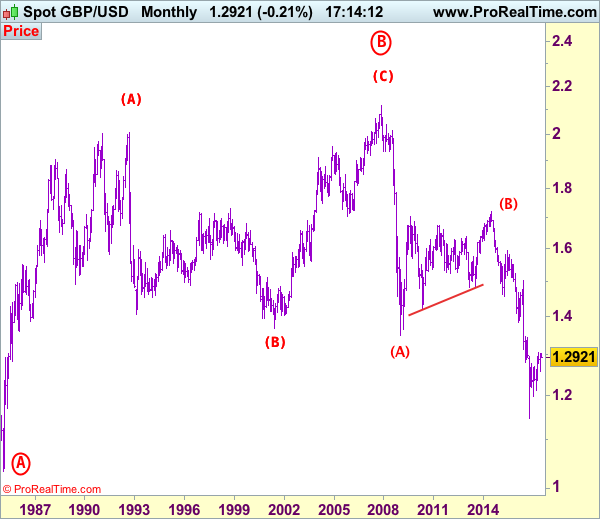
Longer term – Cable’s rise from 1.0520 (Feb 1985) to 2.0100 (September 1992) is seen as [A], the decline to 1.3682 is labeled as (B) and (C) wave rally has ended at 2.1162 (9 Nov, 2007) which is also the top of larger degree wave B with circle. The selloff from there is a 5-waver with wave (A) ended at 1.3500 (23 Jan 2009), wave (B) itself is labeled as A: 1.6733, triangle wave B: 1.4813 and wave C as well as top of wave (B) ended at 1.7192 (2014), hence the selloff from there is an impulsive wave (C) with wave I : 1.4566, wave II 1.5930, an extended wave III is unfolding and already exceeded our downside target at 1.3500 and 1.3000, hence weakness to 1.2500 and possibly 1.2000 cannot be ruled out, however, price should stay well above psychological level at 1.0000.


