
EUR/JPY – 128.25
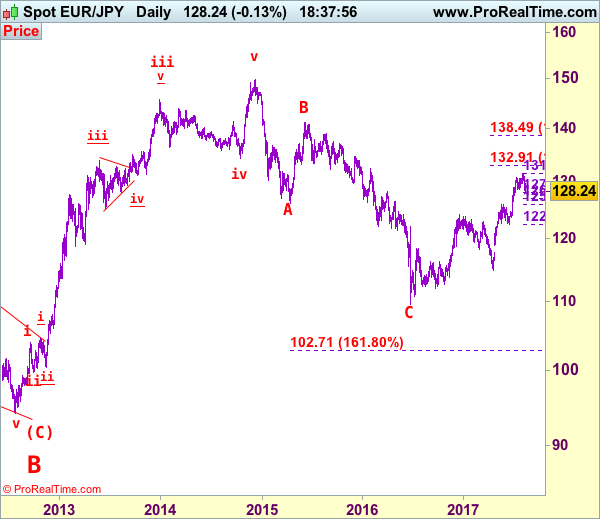
Although the single currency did rebound after finding support at 128.43 earlier this week, renewed selling interest quick emerged at 129.56 yesterday and euro has slipped again, suggesting near term downside risk remains for the retreat from 131.40 temporary top to bring retracement of recent upmove, hence downside risk remains for this move to extend weakness to 127.95-00 (38.2% Fibonacci retracement of 122.38-131.40), then test of support at 127.44 but break of latter level is needed to provide confirmation, bring further fall to 126.45-50, having said that, price should stay above previous resistance at 125.82 (now support) and euro may head north again from there. Only a sustained breach below this level would signal correction of recent upmove has commenced for further fall to 125.15-20 but previous resistance at 124.65 would hold from here.
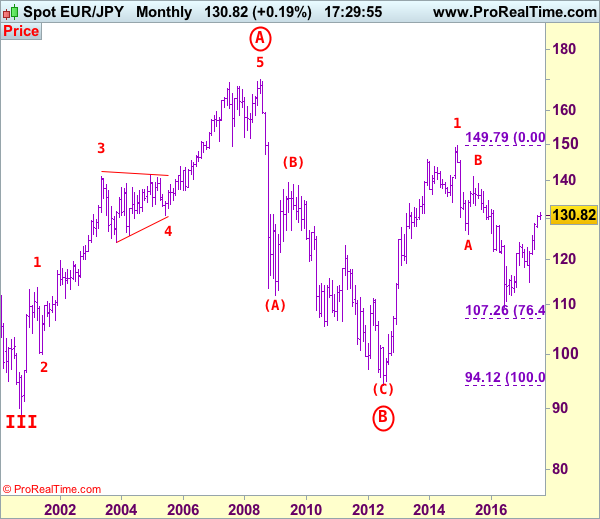
The daily chart is labeled as attached, early selloff from 169.97 (July 2008) to 112.08 is wave (A) of B instead of end of entire wave B and then the rebound from there to 139.26 is wave (B), hence, wave (C) has possibly ended at 94.12 with a diagonal triangle as labeled in the daily chart, hence upside bias is seen for further gain. Recent rally above indicated retracement level at 116.69 (50% Fibonacci retracement of the intermediate fall from 139.26-94.12) adds credence to this view and signal major reversal has commenced but first leg of this wave C has possibly ended at 149.79, hence wave 2 has commenced with wave A ended at 126.09, followed by wave B at 141.06, wave C commenced and could have ended at 109.49, above 126.00 would add credence to this view, then headway to 130.00 would follow.
On the upside, whilst initial recovery to 129.00 cannot be ruled out, reckon said resistance at 129.56 would limit upside and bring another decline later. Above previous support at 130.09 would defer and suggest first leg of decline from 131.40 has ended instead, risk a stronger rebound to 130.50 but upside should be limited to 130.80-85 and price should falter below 131.40, bring another leg of corrective decline later this month. Only above said resistance at 131.40 would extend medium term upmove from 109.49 low (2016 low) to extend further gain to 132.00-10, however, overbought condition should prevent sharp move beyond 132.90-00 (1.236 times projection of 109.49-124.10 measuring from 114.85) and price should falter well below previous chart resistance at 134.59.
Recommendation: Exit long entered at 128.55 and stand aside for this week.
To re-cap the corrective upmove from the record low of 88.93 (18 Oct 2000), the wave A from there is subdivided as: 1:88.93-113.72, 2:99.88 (1 Jun 2001), 3:140.91 (30 May 2003), 4:124.17 (10 Nov 2003) and 5 ended at record high of 169.97 (21 Jul 2008). The brief but sharp selloff to 112.08 is viewed as a-b-c x a-b-c wave (A) of B. The subsequent rebound to 139.26 is (B) of B and (C) of (B) has possibly ended at 94.12 and in any case price should stay well above previous chart support at 88.93, bring rally in larger degree wave C towards 150.00.


