EUR/JPY – 129.83
Although the single currency recovered after finding good support at 129.37 this week, as renewed selling interest emerged at 131.09 yesterday and euro has retreated again, retaining our view that further consolidation below recent high at 131.71 would take place and as long as 131.09 holds, mild downside bias is seen for test of said support at 129.37, break there would bring test of previous resistance at 129.18, below there would suggest top is possibly formed, bring further fall to 128.45-50, break there would bring retracement of recent rise to 128.00-10, then towards previous support at 127.56 which is likely to hold from here. In the event euro drops below 127.56, this would signal correction of recent upmove has commenced and bring subsequent fall to 126.45-50 and later towards previous resistance at 125.82 which is likely to remain intact.
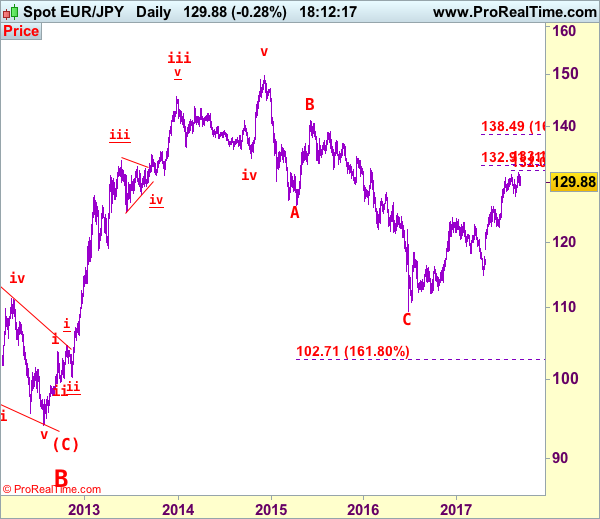
The daily chart is labeled as attached, early selloff from 169.97 (July 2008) to 112.08 is wave (A) of B instead of end of entire wave B and then the rebound from there to 139.26 is wave (B), hence, wave (C) has possibly ended at 94.12 with a diagonal triangle as labeled in the daily chart, hence upside bias is seen for further gain. Recent rally above indicated retracement level at 116.69 (50% Fibonacci retracement of the intermediate fall from 139.26-94.12) adds credence to this view and signal major reversal has commenced but first leg of this wave C has possibly ended at 149.79, hence wave 2 has commenced with wave A ended at 126.09, followed by wave B at 141.06, wave C commenced and could have ended at 109.49, above 126.00 would add credence to this view, then headway to 130.00 would follow.
On the upside, whilst recovery to 130.50-60 cannot be ruled out, said resistance at 131.09 should remain intact, bring another retreat later. A daily close above 131.09 would suggest the retreat from 131.71 has ended instead, bring retest of this level, however, euro needs to penetrate this resistance to revive bullishness and signal the major rise from 109.49 low (2016 low) has resumed for headway to 132.00-10, then 132.50-60 but overbought condition should prevent sharp move beyond 133.10–15 (61.8% projection of 122.40-131.40 measuring from 127.56) and price should falter well below previous chart resistance at 134.59, bring retreat later.
Recommendation: Sell at 130.50 for 128.50 with stop above 131.50.
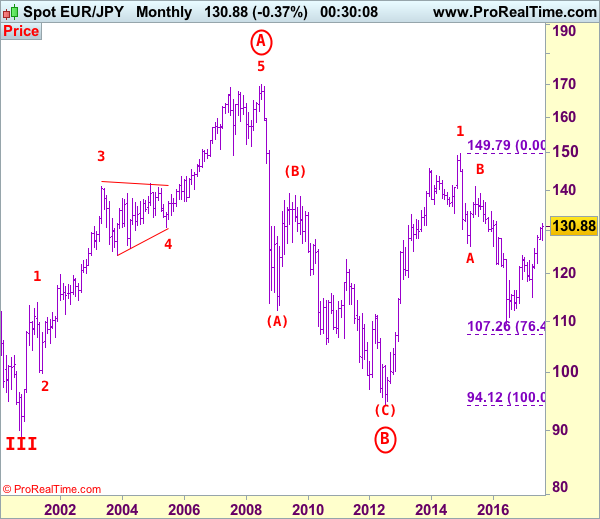
To re-cap the corrective upmove from the record low of 88.93 (18 Oct 2000), the wave A from there is subdivided as: 1:88.93-113.72, 2:99.88 (1 Jun 2001), 3:140.91 (30 May 2003), 4:124.17 (10 Nov 2003) and 5 ended at record high of 169.97 (21 Jul 2008). The brief but sharp selloff to 112.08 is viewed as a-b-c x a-b-c wave (A) of B. The subsequent rebound to 139.26 is (B) of B and (C) of (B) has possibly ended at 94.12 and in any case price should stay well above previous chart support at 88.93, bring rally in larger degree wave C towards 150.00.