
USD/CAD – 1.2354
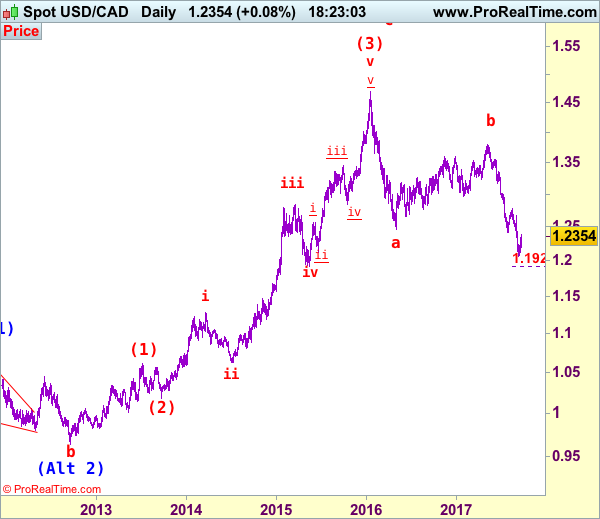
As the greenback found good support at 1.2197 yesterday and has rebounded again, suggesting a temporary low has possibly been formed at 1.2061 earlier this month and consolidation with mild upside bias is seen for the rebound from there to bring retracement of recent decline to 1.2400-10, then towards 1.2440-45 but a daily close above latter level is needed to suggest at least a minor wave v has ended, bring retracement of recent decline to 1.2500, then 1.2550 but price should falter well below resistance at 1.2663, bring retreat later.
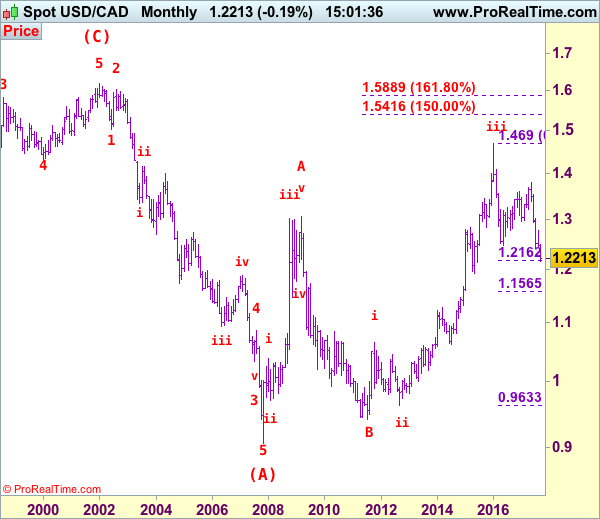
We are keeping our view that the wave b from 1.0657 (a leg top) has possibly ended at 0.9633 with (a): 0.9800, wave (b): 1.0447 and wave c at 0.9633, the subsequent rise from there is now treated as wave c exceeded indicated upside target at 1.3770-80 and 1.4000 and wave (3) has possibly ended at 1.4690 and wave (4) correction has commenced for retracement back towards 1.2000.
On the daily chart, our latest preferred count remains that the A of (B) rally from 0.9059 low (7 Nov 2007) unfolded into an impulsive wave with i: 0.9059-1.0380, ii ended at 0.9819, iii at 1.3019 followed by triangle wave iv at 1.2026 , then wave v formed a top at 1.3066 and also ended the wave A. The wave B is unfolding as an double three a-b-c-x-a-b-c and is sub-divided as a: 1.2192, b: 1.2716 and wave c at 1.0784, followed by wave x at 1.1725, another set of a-b-c unfolded with 2nd a at 0.9931, 2nd b at 1.0674. the 2nd c has possibly ended at 0.9407, therefore, consolidation with upside bias is seen for major correction, indicated target at 1.3900 had been met and gain to 1.4700 would follow.
On the downside, whilst pullback to 1.2250-60 cannot be ruled out, reckon said support at 1.2197 would hold and bring another rebound later. A daily close below 1.2197 would dampen this near term bullishness and risk test of 1.2121 support but only break there would confirm and signal decline has resumed for retest of said recent low at 1.2061. Looking ahead, break of 1.2061 would extend medium term downtrend towards psychological support at 1.2000 but reckon downside would be limited to 1.1925 (61.8% projection of 1.3794-1.2414 measuring from 1.2778). We are keeping our bearish count that wave b ended at 1.3794 and wave c has commenced for further fall towards psychological support at 1.2000.
Recommendation: Buy at 1.2260 for 1.2460 with stop below 1.2160.
Longer term – The selloff from 1.6194 (21 Jan 2002) to 0.9059 (07 Nov 2007) is viewed as (A) wave which is a 5-waver as labeled on the monthly chart as below, the subsequently rally is labeled as (B) with impulsive A leg of (B) ended at 1.3066, wave B of (B) is unfolding which has either ended at 0.9407 or would extend one more fall but downside should be limited to 0.9200 and 0.9000 should hold.


