
GBP/USD – 1.3437
Although sterling resumed recent upmove and rose to as high as 1.3658 last week, lack of follow through buying and the subsequent retreat suggest consolidation below this level would be seen and pullback to 1.3400 cannot be ruled out, however, reckon 1.3350-55 would limit downside and bring another rise later, above 1.3595-00 would signal the retreat from 1.3658 has ended, bring retest of this level, break there would extend the medium term erratic rise from 1.1986 low to 1.3700-10 but overbought condition should limit upside to 1.3800 and price should falter well below 1.3955-60 (50% Fibonacci retracement of intermediate downtrend from 1.5930-1.1986).
Our preferred count on the daily chart is that cable’s rebound from 1.3500 (wave (A) trough) is unfolding as a wave (B) with A ended at 1.7043, followed by triangle wave B and wave C as well as wave (B) has possibly ended at 1.7192, below support at 1.4232 would add credence to this count, then further fall to 1.4000 level would follow but reckon downside would be limited to 1.3655 support and price should stay above previous support at 1.3500.
On the downside, although current pullback from 1.3658 suggests initial downside risk is for minor correction to 1.3400, reckon downside would be limited to 1.3350-55 and bring another rise later to aforesaid upside targets. Below previous resistance at 1.3329 (now support) would defer and suggest a temporary top is possibly formed, bring retracement of recent rise to 1.3290-00, then 1.3240-50 but said support at 1.3153 should remain intact, bring another upmove later.
Recommendation: Buy again at 1.3355 for 1.3555 with stop below 1.3255.
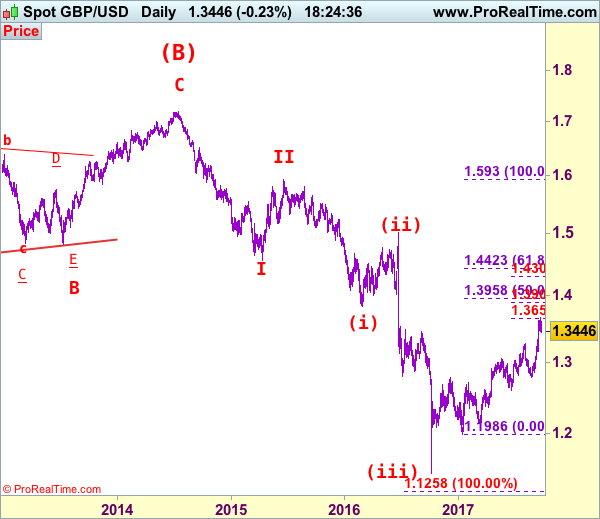
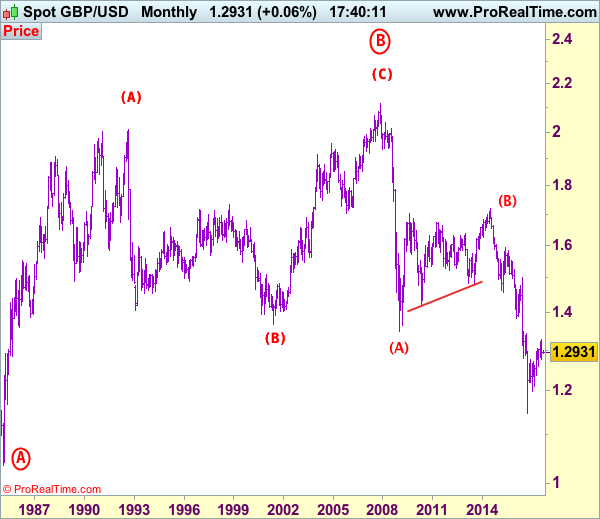
Longer term – Cable’s rise from 1.0520 (Feb 1985) to 2.0100 (September 1992) is seen as [A], the decline to 1.3682 is labeled as (B) and (C) wave rally has ended at 2.1162 (9 Nov, 2007) which is also the top of larger degree wave B with circle. The selloff from there is a 5-waver with wave (A) ended at 1.3500 (23 Jan 2009), wave (B) itself is labeled as A: 1.6733, triangle wave B: 1.4813 and wave C as well as top of wave (B) ended at 1.7192 (2014), hence the selloff from there is an impulsive wave (C) with wave I : 1.4566, wave II 1.5930, an extended wave III is unfolding and already exceeded our downside target at 1.3500 and 1.3000, hence weakness to 1.2500 and possibly 1.2000 cannot be ruled out, however, price should stay well above psychological level at 1.0000.


