EUR/USD – 1.1751
EUR/USD: Wave (c) of 2 ended at 1.3993 and wave 3 of III has commenced for weakness to 1.0411 (1.236 of wave 1), then 1.0000.
Although the single currency rebounded to 1.1858 last week, as the pair has retreated after faltering below resistance at 1.1880, suggesting further consolidation would take place, however, still reckon support at 1.1730 (last week’s low) would limit downside and bring another rebound later. Above 1.1858 would bring test of 1.1880 resistance, a daily close above there would suggest the pullback from 1.2093 has ended at 1.1669, bring further gain to 1.1950-60, then towards 1.2000-05. Only a break of resistance at 1.2034 would confirm and bring retest of 1.2093, break there would signal recent upmove from 1.0340 low has resumed for headway to 1.2150-55 (61.8% projection of 1.1119-1.1910 measuring from 1.1662), having said that, loss of upward momentum should prevent sharp move beyond 1.2200-10 and price should falter below 1.2255-60, risk from there remains for a much-needed correction to take place later.
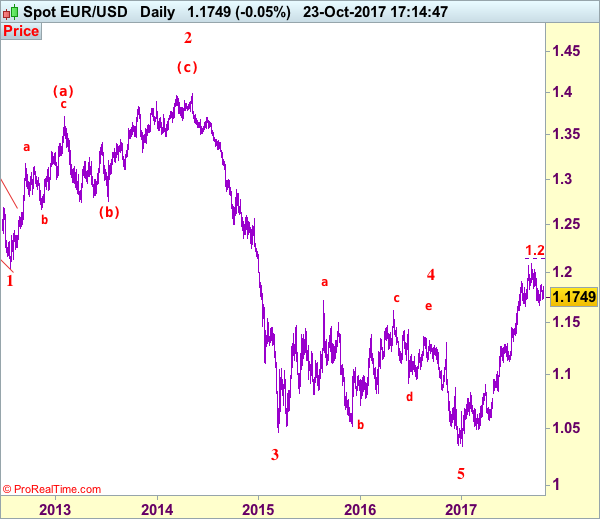
Our preferred count on the daily chart remains that a wave (II) from 1.2329 ended at 1.5145 with A-leg ended at 1.4720, followed by wave B at 1.2457, the wave C from there was also a 3 legged move and is labeled as (a): 1.3739, (b): 1.2885, the wave iii of the 5-waver (c) from 1.2885 has ended at 1.4339 and wave iv is a triangle ended at 1.3878 and wave v formed a top at 1.5145. The decline from there is a 5-waver (C) with minor wave (i) of I of (C) ended at 1.4218 with wave (ii) ended at 1.4580, wave (iii) ended at 1.3267 and wave (iv) ended at 1.3692 and wave (v) ended at 1.1876, this is also the low of wave I of (C) and wave II ended at 1.4940, hence wave III is now in progress with a diagonal wave 1 ended at 1.2042, the breach of previous support at 1.1876 (wave I trough) adds credence to our view that the wave 2 has ended at 1.3993, wave 3 has commenced for further weakness to 1.0411, then towards 1.0000.
On the downside, a drop below said support at 1.1730 would risk another fall to 1.1669 but only a sustained breach below this level would signal the leg of corrective fall from 1.2093 top is underway for retracement of early upmove to previous support at 1.1662 (previous 4th of a lesser degree), break there would extend weakness to 1.1600-10 and possibly 1.1550-60 but reckon downside would be limited to 1.1500 and support at 1.1479 should remain intact, bring rebound later.
Recommendation: Hold long entered at 1.1765 for 1.1965 with stop below 1.1665.
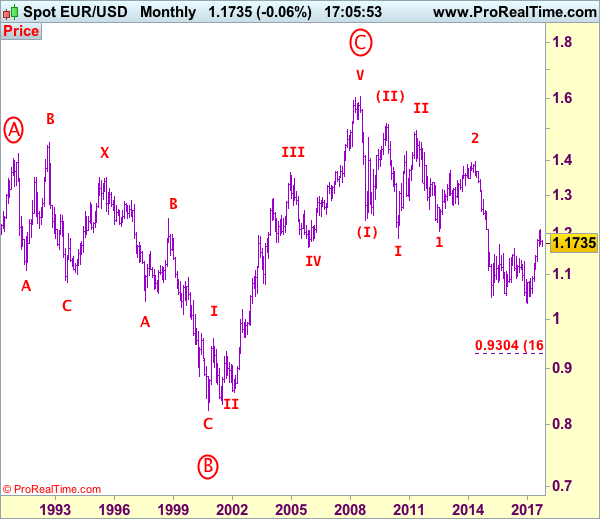
Euro’s long-term uptrend started from 0.8228 (26 Oct 2000) with an impulsive structure. The rise from 0.8228 to 0.9593 (5 Jan 2001) is labeled as wave I, the retreat to 0.8352 (6 Jul 2001) is wave II and the rally to 1.3670 (31 Dec 2004) is wave III. Wave IV from there ended at 1.1640 (15 Nov 2005), the subsequent upmove to 1.6040 (July 15, 2008) is treated as wave V, the major selloff from the record high of 1.6040 to 1.2329 (October 27, 2008) signals a reversal has taken place with (I) leg ended at 1.2329 and once (II) ended at 1.5145, wave (III) itself is an extended move with I: 1.1876 and complex wave II ended at 1.4902, wave III has commenced with wave 1 and 2 ended at 1.2042 and 1.3993 respectively, wave 3 of III is now unfolding for weakness towards parity.