AUD/USD – 0.7777
As aussie has retreated after faltering below resistance at 0.7897, adding credence to our view that the rebound from 0.7733 has possibly ended at 0.7897, hence bearishness remains for a retest of this level but break there is needed to confirm the decline from 0.8125 top has resumed for retracement of early upmove to previous resistance at 0.7712, break there would bring further fall towards 0.7640-50 but near term oversold condition should limit downside and reckon support at 0.7570 would hold.
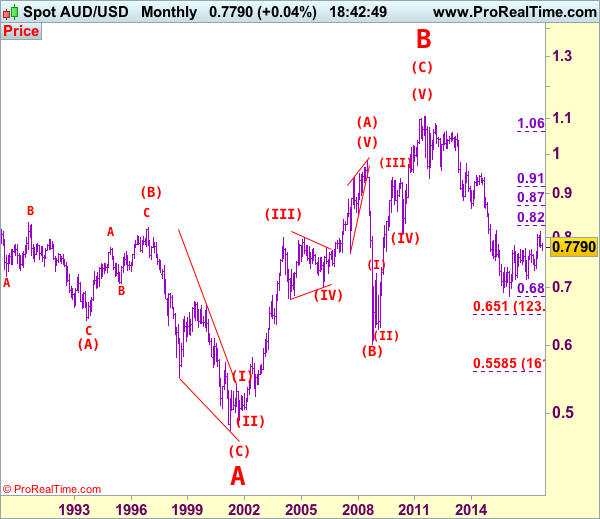
We are keeping our count that top has been formed at 1.1081 (wave 5 of V) and major correction (A-B-C-X-A-B-C) has commenced, indicated downside targets at 0.7945 (61.8% Fibonacci retracement of entire rise from 0.6007-1.1081) and 0.7750 had been met and downside bias is seen for further weakness to 0.6800, then 0.6700 but reckon 0.6500 would hold from here.
Our preferred count is that the rally from 0.6007 to 0.7270 (7 Jan 2009) is marked as wave A, the retreat to 0.6248 (2 Feb 2009) is wave B and the subsequent upmove is labeled as wave C with wave (iii) and wave (iv) ended at 0.8265 and 0.7700 respectively and wave (v) as well as 3 ended at 0.9407, then wave 4 ended at 0.8066 (instead of 0.8578). The wave 5 has met our indicated projection target of 1.1060 and could ended at 1.1081, this level is now treated as the peak of wave (C) as well as larger degree wave B, hence major fall in wave C has commenced, our initial downside target at psychological support at 0.7000 has just been met and further weakness to 0.6500 would be seen later.
On the upside, expect recovery to be limited to 0.7720-30 and bring another decline to aforesaid downside targets. Above said resistance at 0.7897 would abort and signal low has been formed instead, risk test of previous support at 0.7908, break there would signal first leg of decline from 0.8125 has ended instead, bring a stronger rebound to 0.7940-50 but upside should be limited to 0.8020 and bring another decline later. A daily close above 0.8020 would risk test of 0.8080 but only break of resistance at 0.8103 would signal correction from 0.8125 has ended, bring retest of this level first.
Recommendation: Hold short entered at 0.7870 for 0.7670 with stop above 0.7850.
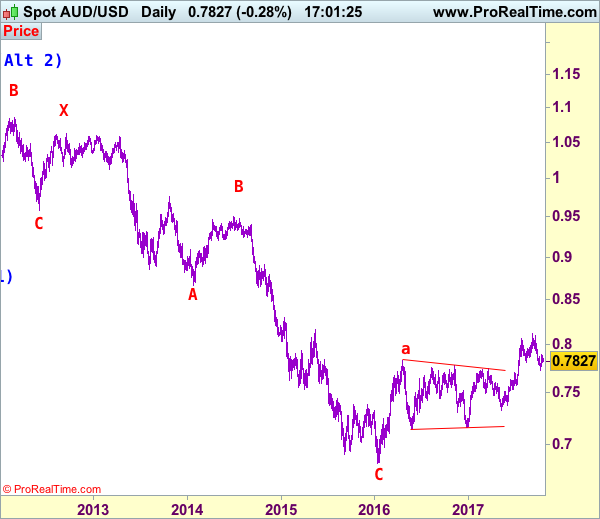
Our alternate count on the daily chart treated the top formed in 2008 at 0.9851 could be a larger degree wave I and was followed by a deep and sharp correction in wave II to 0.6007 and wave III is unfolding from there.
The long-term uptrend started from 0.4775 (2 Apr 2001) with an impulsive structure. Wave I is labeled as 0.4775 to 0.9851 (15 Jul 2008), wave II has ended at 0.6007 (Oct 2008) and wave III is still in progress which may extend further gain to 1.1265.