
Moving Averages are by far the most widely used and easy to understand forex indicator. They display right on top of your chart and mechanics are very easy to understand – a moving average or MA – is quite simply the average price over a given period.
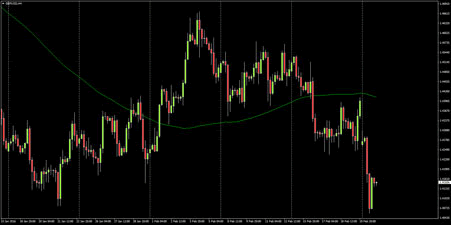
This is one of the more common Moving Averages – SMA100 – the Simple Moving Average of the close price for the last 100 bars. We have placed the SMA100 over the GBP/USD forex pair on a 4 hour chart.
The simplest form of MA analysis is checking where price is in relation to the MA – is price above the 100SMA? Look to buy. Is price below? Look to sell.
That is, when GBP/USD is above the 100SMA, we will look to buy lows, when it below the 100SMA, we will look to sell highs:
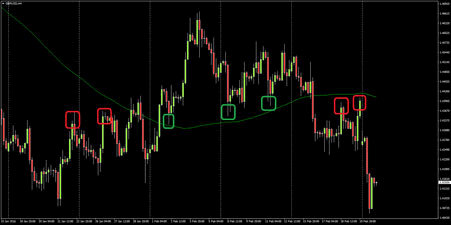
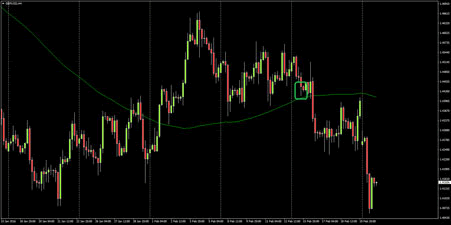
As you can see, this is quite a reliable strategy at first glance – all the marked highs below the SMA lead to substantial declines and all the marked lows above the SMA lead to substantial bounces. Realistically though, this image was created with the benefit of hindsight – a live forex trader may well have bought the final touch of the 100 SMA:
Even so, GBP/USD did appreciate 75 pips before eventually breaking lower – Our hypothetical trader could have taken profit, moved his stop loss to break-even or, lost a small amount when pair breached the SMA. Let’s say the trader lost on this one, but 7 wins out of 8 trades is still extremely impressive!
You will rarely see a moving average in isolation like this, most traders will use a combination of a ‘fast’ and ‘slow’ moving average. We go into more detail on moving average trading in the next section.


