
The harmonic domain is a bizarre, yet intriguing, phenomenon for most traders.
While some dismiss the approach entirely, others are unable to trade without it.
Despite this separation, don’t let it discourage you from its teachings as it could prove to be a real game changer!
Harmonic patterns
Harmonic patterns are defined by specific price structures, operating on the premise that Fibonacci sequences can be used to build orderly structures. Together, these areas provide traders a base in which to initiate high-probability trades from.
And this is where the Gartley harmonic formation comes in…
The Gartley harmonic pattern
Roots of harmonic trading can be tracked down to the Gartley pattern, or sometimes referred to as ‘Gartley 222’. Introduced by H.M. Gartley in his book Profits in the Stock Market in 1932, the 5-point retracement structure is the oldest and most documented harmonic pattern. Larry Pesavento later applied Fibonacci ratios to the pattern in his book Fibonacci Ratios with Pattern Recognition.
It is suggested that the Gartley harmonic formation, on average, has a success ratio of about 70%. While this sounds absolutely fantastic, it is a tad presumptuous to state any success percentage without specifying money management rules, instruments traded, tested period, trading experience and applied confirmation methods. Therefore, conduct thorough research before risking your life savings!
Breaking it down
In the beginning, the Gartley harmonic pattern can be tricky to spot. It can also quickly get confusing when you overload the charts with Fibonacci measurements. The key to avoiding this is to take it one step at a time:
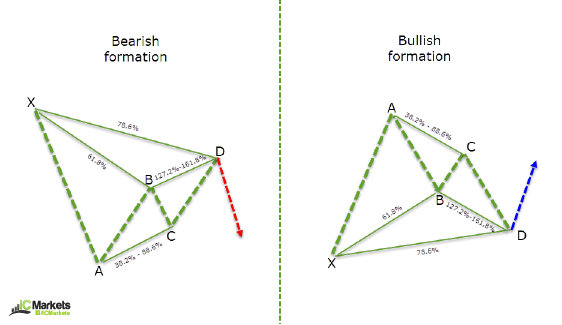
Step 1: Locate the impulse leg. This is a strong move in either direction. It can be a mixture of both bullish and bearish candles, but must still be a defined move. The beginning of the impulse move is labelled as X and the tip of the move as A.
Step 2: At this point, you’re looking for a retracement to occur: the B leg. Using your Fibonacci retracement tool, measure from the X leg to the A leg. The Fibonacci support you should be targeting is a 61.8% retracement value.
Step 3: Using your Fibonacci retracement tool again measure from the A leg to the B leg. The termination point here is somewhat flexible. As long as price concludes movement between 38.2%-88.6% you’re good to go. This is your C leg.
Step 4: Here you’ll look for the final leg to form: the D leg. This is where you will be looking to formulate your potential reversal zone (PRZ). Ideally, you should be targeting a symmetrically sized AB=CD completion that converges with a 127.2% Fibonacci extension point (measured from the A leg to the B leg and then back to the A leg), and a 78.6% Fibonacci retracement measured from the X leg to the A leg.
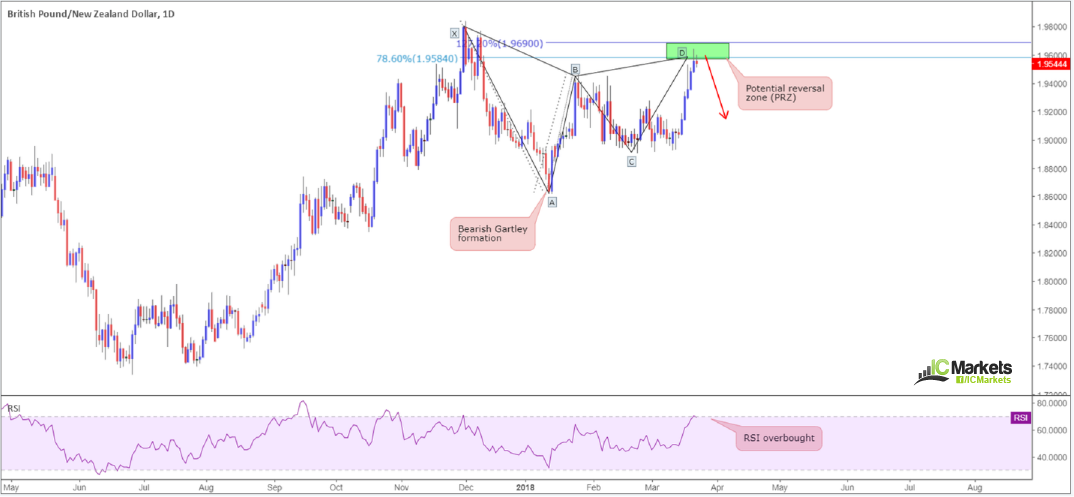
Here is a bearish Gartley harmonic pattern currently in play on the weekly chart of the GBP/NZD:
Trade management
Stop placement: 2-5 pips beyond the 161.8% Fibonacci extension of the A/B leg measurement. Some, however, prefer to use structure if this value poses too big of a stop distance. In the case of the setup posted above, stops placed above the X point of the Gartley formation would suffice, in our view.
Take-profit target 1: 38.2% Fibonacci retracement of legs A-D. When this level has been hit, you are encouraged to reduce risk to breakeven.
Take-profit target 2: 61.8% Fibonacci retracement of legs A-D. When this level has been hit, you are encouraged to take partial profits and trail stops using market structure (support and resistance).
One final point
While some solely trade this pattern in isolation, we feel they perform best when combined with additional tools.
Should the pattern’s PRZ converge with a notable trendline or support/resistance hurdle, for example, this will add weight to the trade moving in favour. Another essential point to consider is the trend direction. Trading this method against the trend is likely why many fail to achieve success using this formation.
An example of uniting other tools can be found on the GBP/NZD setup posted above where we utilized the RSI’s overbought reading along with the Gartley’s PRZ.
In closing
Do yourself a huge favour and start logging down historical setups. After the first ten you may begin seeing just how accurate these patterns truly are!