
Trading with chart patterns can be one of the simplest ways to find highly profitable trade setups. Despite the ease of trading with chart patterns, there is quite some subjectivity involved which can be a put off for newcomers.
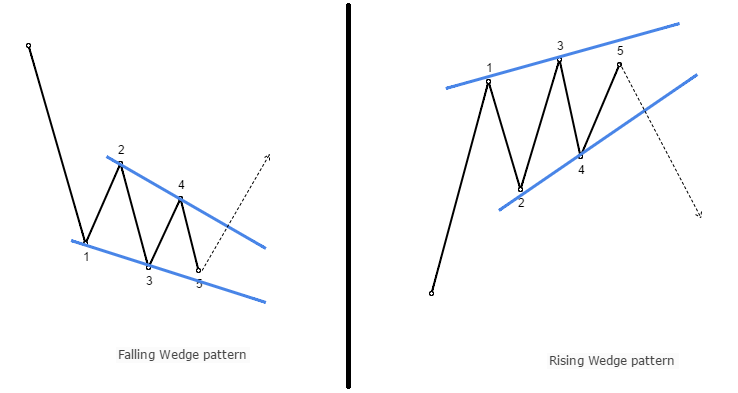
While there are many different chart patterns, one of the most commonly occurring pattern is the wedge pattern. Classified into a rising wedge or a falling wedge, these patterns are formed after a strong rally or a decline in price. They usually occur at the end of the strong move and signals exhaustion in the price momentum. Trading the wedge pattern is a typically counter trend as a breakout from the pattern could either signal a correction or a potential change in trend itself.
The picture below illustrates a rising and a falling wedge pattern at its simplest form.
Characteristics of a Wedge pattern
- There must be a clear trend, prior to the wedge pattern. This is signified by price making higher highs and lows in an uptrend and comes ahead of a rising wedge pattern or lower lows and lower highs in a downtrend which comes ahead of a falling wedge pattern
- Towards the top end of the rally or towards the end of the declines, look for potential consolidation with the peak and valley start to move into a smaller range
- Using a trend line, connect the highs and lows and look for a triangle type of consolidation
- Wait for price to break the wedge or triangle pattern
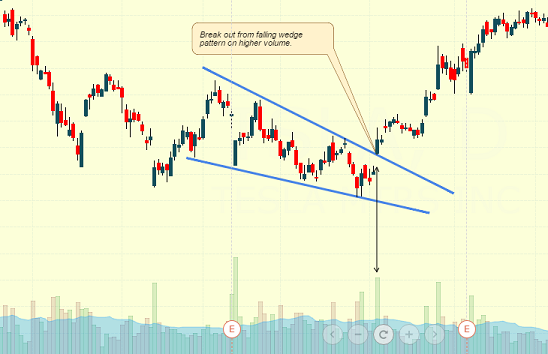
Note: When trading with stocks, the breakout from the wedge pattern is usually confirmed by higher volume. The following two charts illustrate this point.
In the first chart below, notice the falling wedge pattern which came after a prolonged downtrend. Then, prices started to consolidate into a wedge pattern with the breakout from the falling wedge coinciding with higher volume.
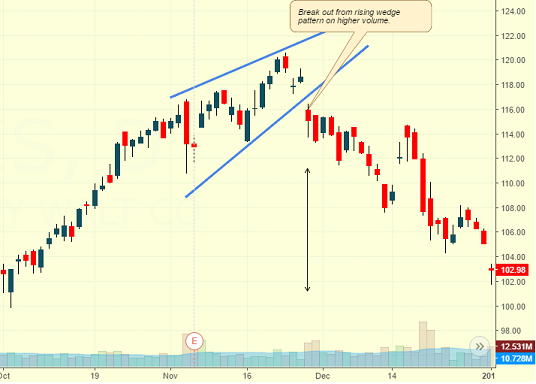
In the next chart, a rising wedge pattern is formed after a steady uptrend. After a series of higher highs and higher lows, price starts to consolidate into a wedge pattern. The breakout is confirmed by the higher volume resulting in prices moving lower.
In the forex markets, the volume cannot be used as an accurate measure due to the de-centralized nature of the forex markets. Therefore, to supplement the volume, we make use of divergence. For divergence, we look for either a bullish or a bearish divergence inside the wedge pattern. To spot the divergence, any oscillator can be used. Typically the RSI, MACD, Stochastics or Awesome oscillator can be used to make it easy.
How to set targets in a wedge pattern?
The wedge pattern can be generally customized in terms of trading the pattern breakout with traders devising their own rules. There are two most widely accepted rules in setting targets in the wedge pattern.
- Target point A or 0, the first peak of valley in the pattern, following the breakout
- Project the highest and lowest point in the wedge from the breakout
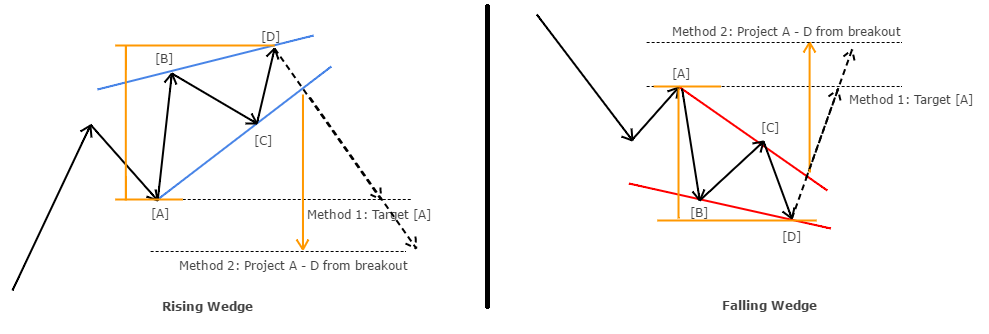
As with most chart patterns and breakout methods, prices can retrace the breakout level before resuming its direction. The wedge pattern is no different either. For stops, the point D, which is the highest point in a rising wedge and the lowest point in the falling wedge is used at a level for set the stop losses.
Trading the rising wedge pattern
The following chart for EURUSD showed a rising wedge pattern that was formed with prices moving steadily higher.
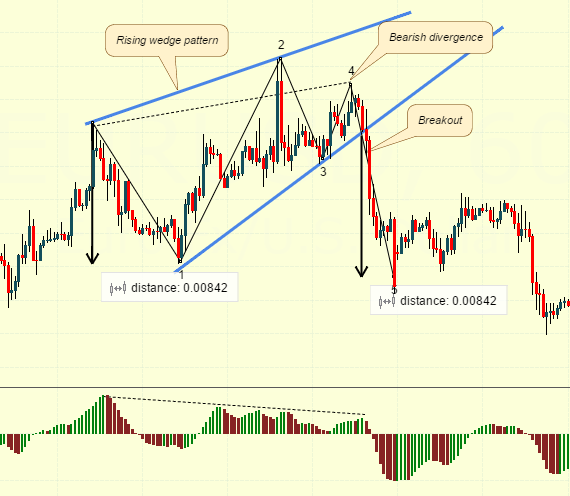
Notice the bearish divergence (marked by the dashed line) that is identified following the rising wedge pattern. This is used as a confirmation that prices will push lower. Following the break of the trend line from the rising wedge pattern, using the distance measured from point 0 – 1 the same distance is projected from the breakout level.
Trading the falling wedge pattern
The next chart below shows a falling wedge pattern, identified on the 30-minute chart time frame.
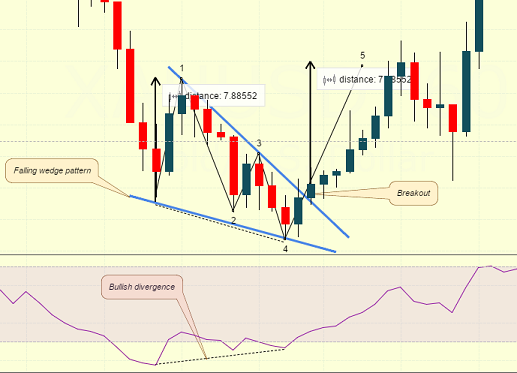
Here, instead of the Awesome Oscillator we make use of the RSI. Following the consolidation pattern and noticing the bullish divergence, a long set-up is taken on the breakout from the falling wedge pattern with the target set to the same distance as from point 0 – 1.
In summary:
- The rising or falling wedge pattern is typically triggered following a strong uptrend or a downtrend;
- The wedge pattern signals exhaustion of momentum that triggered the previous trend. Therefore a successful breakout from a wedge pattern can see price retrace the previous trend, in some cases, it can also signify a change of trend as well;
- Volume is generally used a confirmation of the breakout in stocks. For the forex markets, divergence can be used as a confirmation of the breakout;
- Based on the target methods, the wedge pattern offers a fairly good 1:2 or higher risk reward ratio;
- Using candlestick confirmations on the time frame that the wedge pattern occurred or on higher time frame can bring additional confidence to the trade set up.