
The history of trading bands, envelopes and channels is long and interesting.
In the years since the creation of Bollinger Bands in 1983, a number of adaptive bands were created. Chief among them were Keltner Channels, introduced by Chester Keltner in the 1960s. This technical indicator is similar to Bollinger Bands, though rather than using the standard deviation, Keltner Channels use the Average True Range (ATR) to set channel distance.
Created by John A. Bollinger, Bollinger Bands have undoubtedly stood the test of time and proven to be one of the more robust indicators available in the technical community today.
A recognised trader, multiple books, TV appearances, investments, numerous board memberships with Technical Associations and a research firm, certainly places Bollinger at the top of the pile in the trading arena.
Bollinger Band construction
The structure behind the trading bands is quite straightforward, visually depicted using three lines enveloping market data:
Bollinger Bands are envelopes plotted at a standard deviation level above and below a simple moving average (SMA), usually set to a period of 20 days (approximately the number of trading days in a month). Because the distance of the bands is based on standard deviation, they adjust to volatility swings in the underlying price.
The central line serves as a foundation to create its surrounding bands. Typically, the outer lines are positioned at two standard deviations.
According to Bollinger, approximately 90% of price action occurs between the two bands at 20 periods and two standard deviations.
Should traders feel the need to alter the calculation period and keep the containment percentage constant, however, increasing/decreasing the bandwidth is necessary.
Bandwidth measures the distance between the two bands using the following calculation: BW = (Upper BB – Lower BB) / Moving Average. Shortening the calculation period to 10 days, it is recommended to decrease the bandwidth from 2.0 to 1.9, whereas lengthening the calculation period to 50 days, increasing the bandwidth from 2.0 to 2.1 is suggested.
The many uses Bollinger Bands offer
Identify overbought/oversold markets:
When price action approaches the upper Bollinger Band, the indicator considers this a statistically ‘expensive’ market, or more commonly referred to in the technical world as ‘overbought’. The same can be said for a market testing the lower band, only this position defines a ‘cheap’ market, or ‘oversold’. The logic here comes from the upper and lower bands being positioned two standard deviations from the market average (the mean), which in the case of Bollinger Bands, as emphasised above, is a 20-day simple moving average.
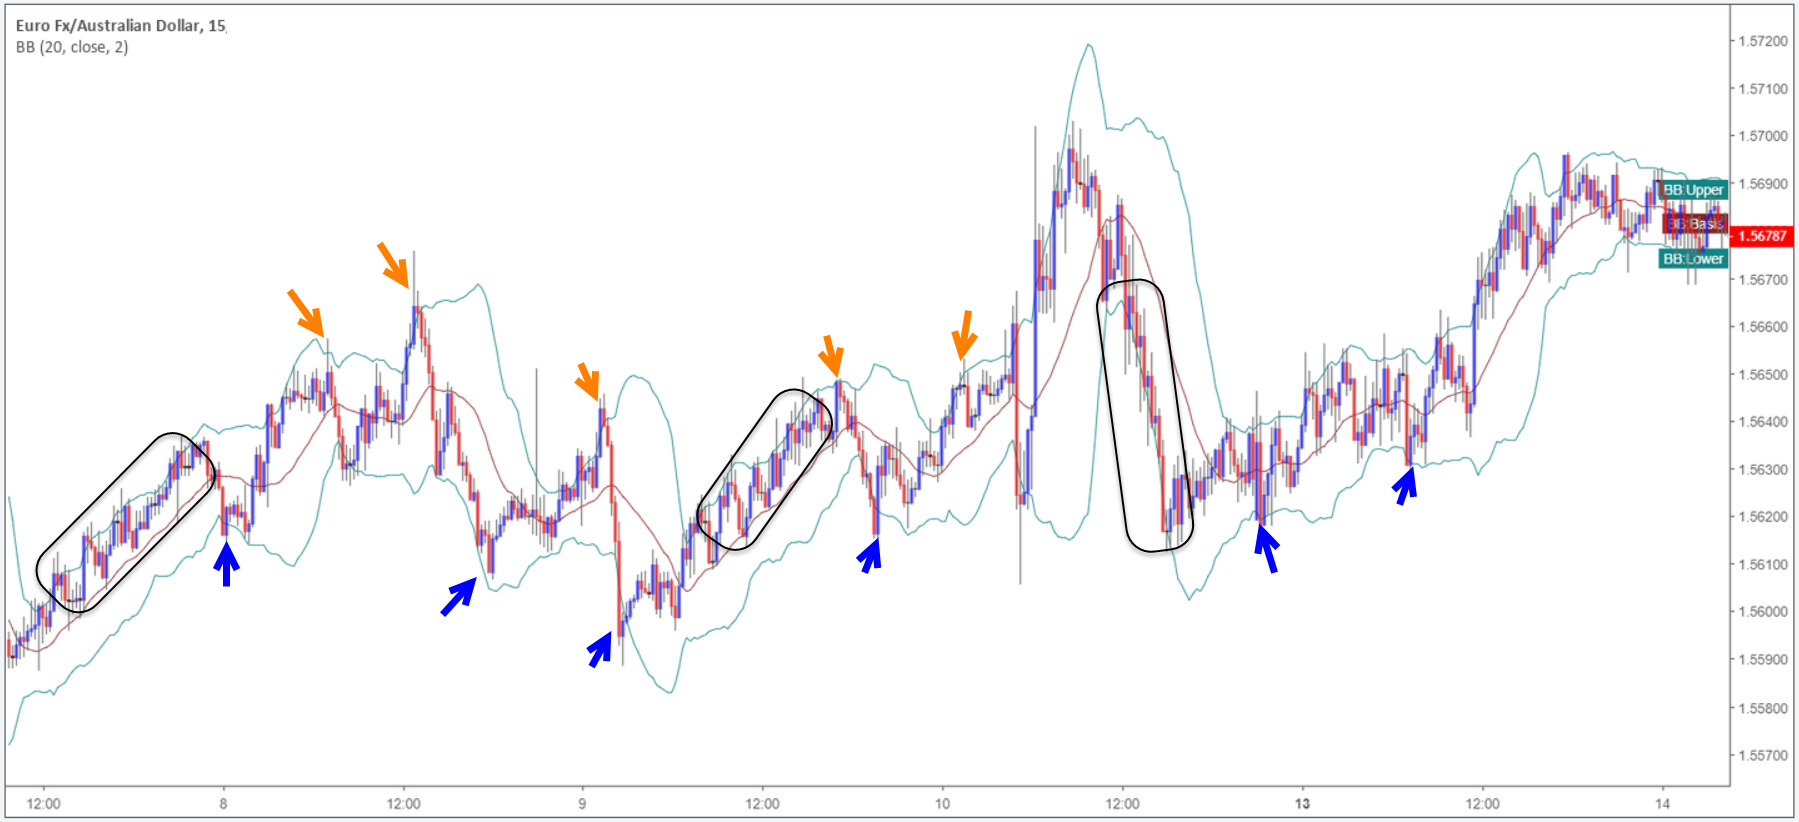
Although relatively straightforward, trading overbought/oversold points in isolation is challenging. Check out the EUR/AUD currency pair (M15 timeframe) posted below, you clearly see instances the upper and lower bands highlighted potential areas to trade (orange and blue arrows), though there are also times (black zones) the candlesticks hugged the upper and lower bands.
While the bands do underline overbought/oversold points, it does not always translate to a trading opportunity. The reason being is trending markets, or extended moves, forces price action to skirt the upper and lower bands.
Recognise market volatility:
Bollinger Bands provide traders a clear visual of market volatility.
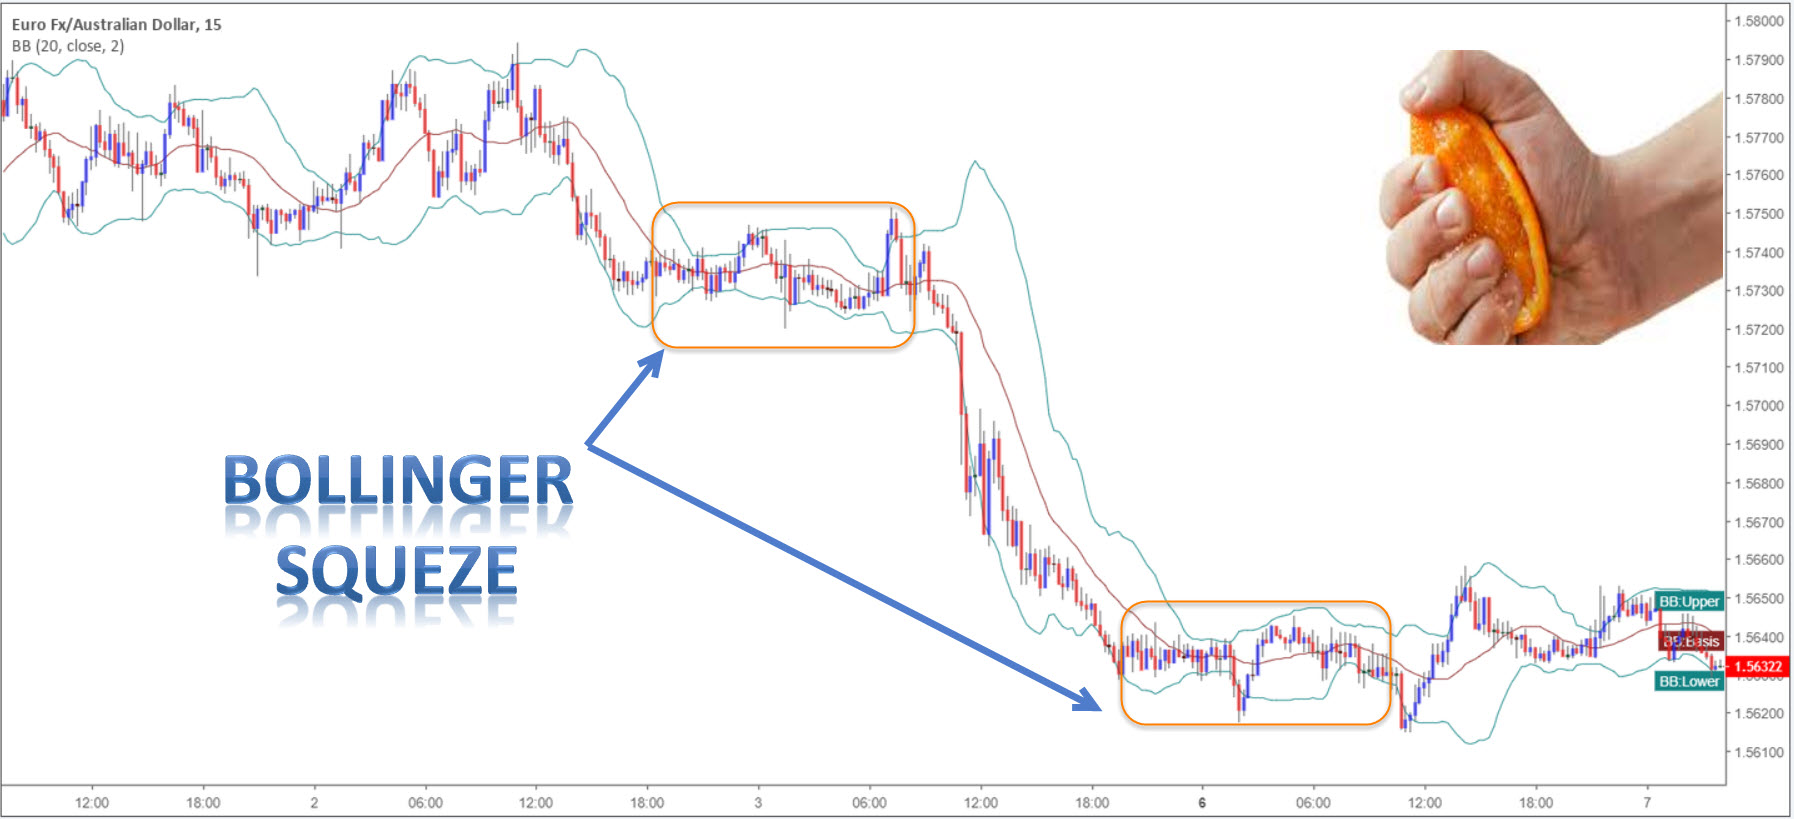
Sometimes referred to as ‘the squeeze’, Bollinger Bands expand on high volatility and contract, or squeeze, on low volatility. Unless you’re a scalper looking to pick off small moves, avoiding environments exhibiting low volatility is likely best, given the limited profit potential.
Below is a typical Bollinger squeeze:
Detect potential breakouts:
Due to the fact volatility generally expands following a period of contraction, identifying possible breakouts using Bollinger Bands is a popular strategy. Traders can visually recognize when an instrument is consolidating on low volatility as the upper and lower bands squeeze – the Bollinger squeeze as briefly featured above.
Not only useful for breakout traders, trend traders also find this technique particularly valuable to ascertain trend strength, offering opportunities to potentially jump aboard a trend or pyramid a current position.
The longer price action remains within its consolidation, the stronger the breakout tends to be.
Methods of confirming a breakout using Bollinger Bands come in many forms. The most obvious is a candle close beyond the outer limits. Some prefer to observe two candle closes, though this would get you in at a worse price and reduce risk/reward.
Not a standalone indicator
Although Bollinger Bands are a favourite among technical analysts, using it alongside additional tools as a basis for a complete trading strategy is highly likely going to improve your bottom line.
As is the case with most technical indicators, making informed trading decisions based on one indicator is a challenge. Some would say impossible. Bollinger considers convergences between Bollinger Bands and technical tools (technical analysis) to be a successful approach.
Implementing trend analysis, alongside the Bollinger Bands, has, for some traders, proven a fruitful method. If a market is trending north for an extended period of time, initiating short positions is a chancy play; even if price is touching the upper Bollinger band (overbought) or has broken the lower Bollinger Band (indicating a breakout to the downside may occur).
Below is a good example of a trending currency pair converging with a trend line support at the lower Bollinger Band during a time the indicator was emphasizing low market volatility. Also note, there was a candlestick close to the downside through the lower edge of the Bollinger Band marked with a blue arrow. Entering short on this candle close as a breakout setup, in this situation, meant selling within a trending market that was approaching a trend line support. As you can see, in conditions like this, trend analysis saved an unnecessary loss.
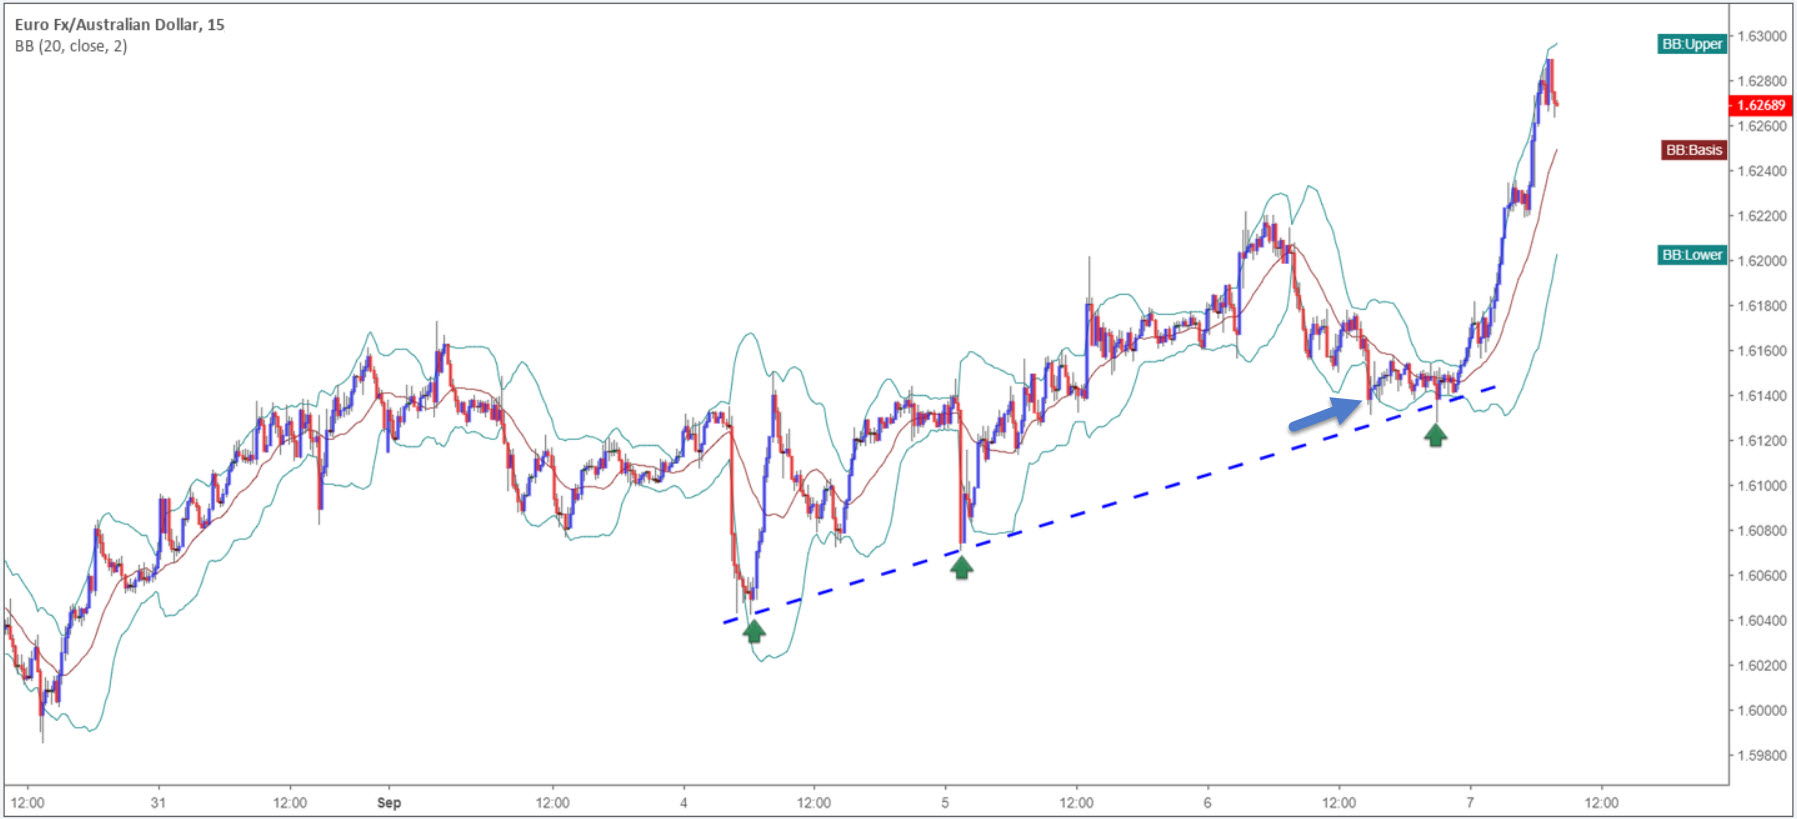
Support and resistance also plays a key part in determining the validity of a Bollinger Band signal. Looking at the same chart (posted below); there was a clear level of resistance-turned support in view. By selling the initial breakout (marked with a blue arrow on the chart above) it entailed shorting into not only the immediate trend, a clear trend line support but also a notable support level!
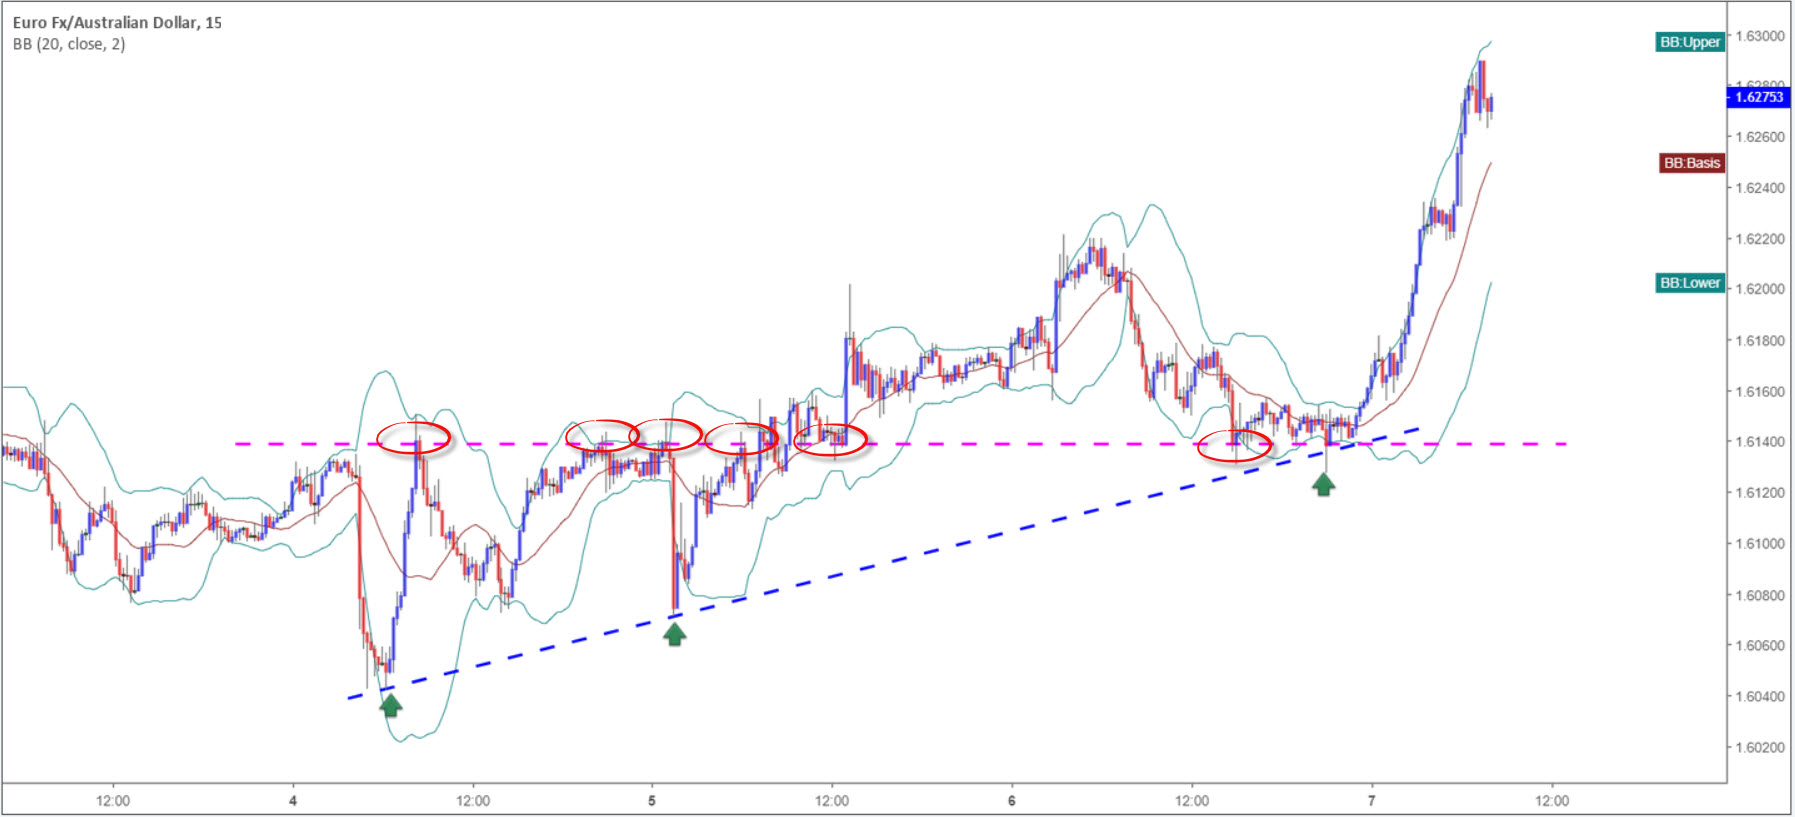
If a support level, a trend line support and trend direction is not enough to confirm a long bias from the lower Bollinger Band, maybe having a 61.8% Fibonacci support level fuse with the area may help:
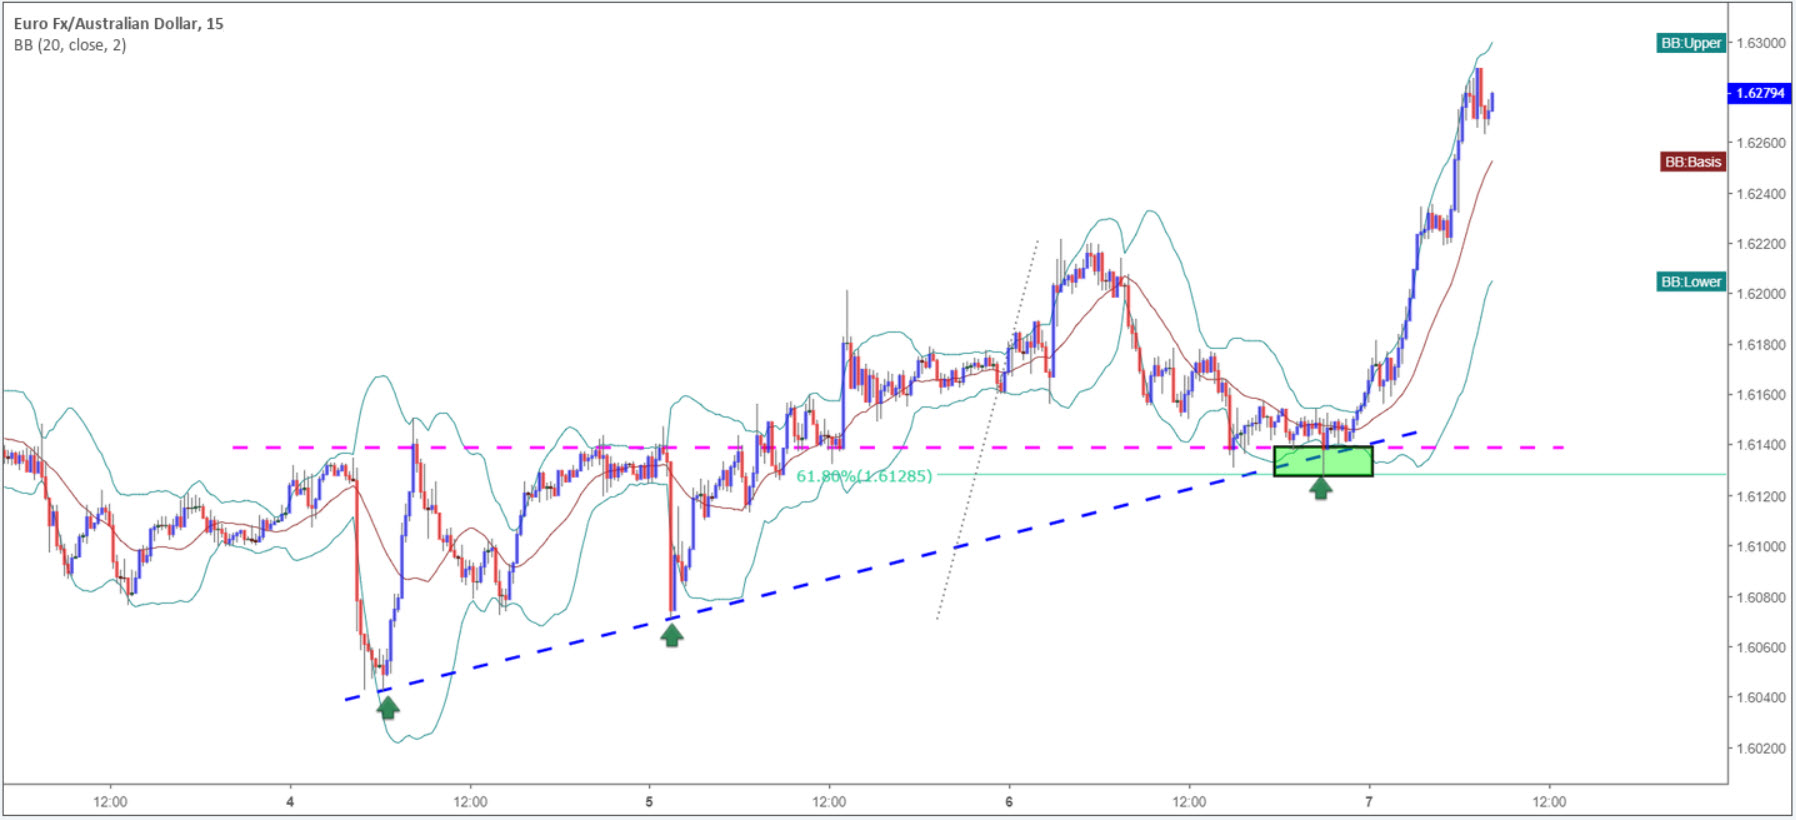
What you effectively did here was take the Bollinger bands as a foundation and shape a buy zone (marked in green) using multiple points of confluence. You also avoided a potential loss.
Of course, not all trades will deliver reversals quite as large as the one depicted above, though very often Bollinger bands supported with additional technical confirmation will produce a sizeable bounce.
Bottom line
Considering most trading platforms offer in excess of 100 indicators, using technical analysis as a mode to trade is difficult for a lot of newer traders. Using the Bollinger Bands as a footing can simplify your trading strategy. Besides the indicator classifying overbought and oversold points in the market, it recognises market volatility and detects possible breakouts. This – coupled with additional technical tools like the ones underlined above – makes it a formidable methodology.